
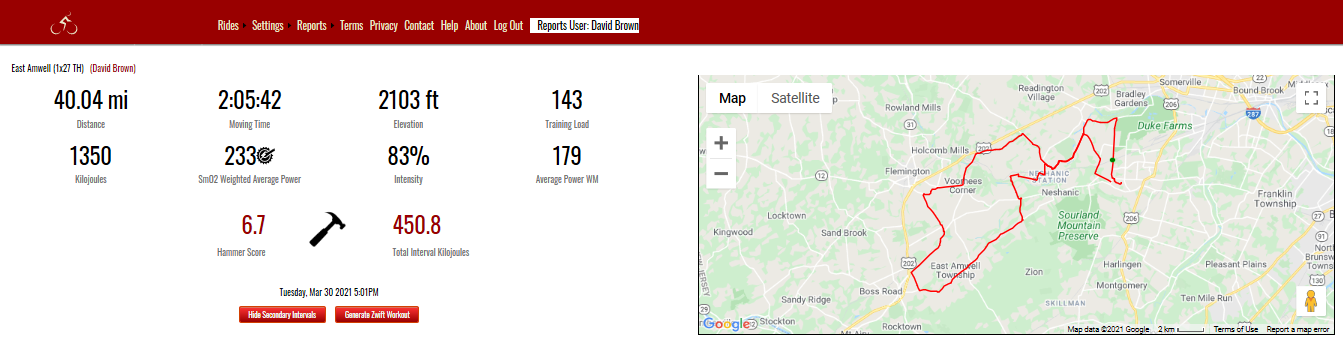
| Ride Header Basic summary stats plus a full ride map. |
|
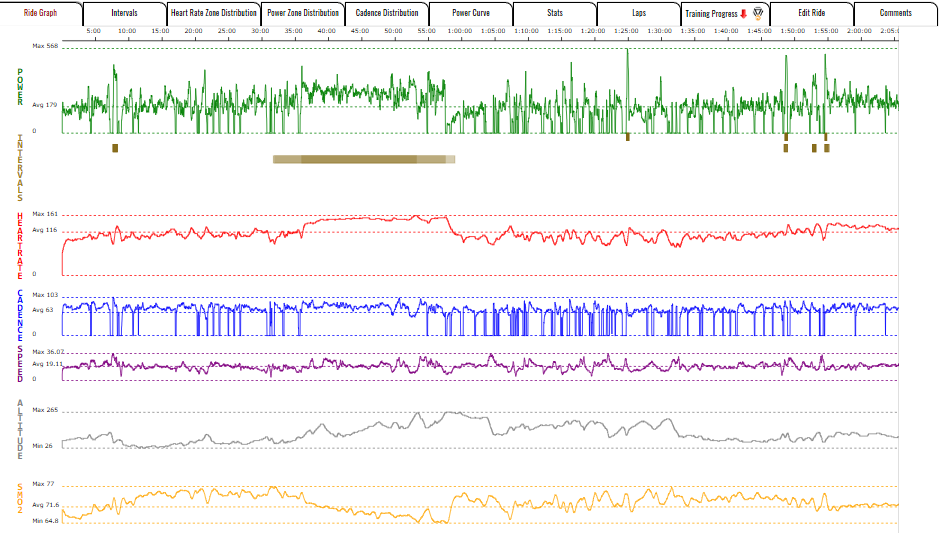
| Ride Graph Tab Second-by second display includes Power, Intervals, Heartrate, Cadence, Speed, Altitude, and SmO2 (muscle oxygen) |
|
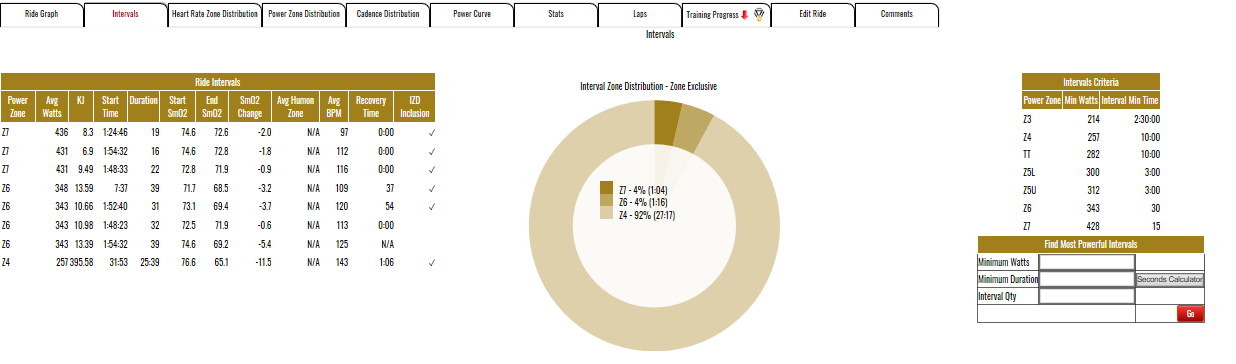
| Intervals Tab Tabular listing of all of a ride's important intervals. Interval Zone distribution adds up the work for you into a meaningful summary. Interface to search for the most powerful of a ride's intervals above a specified wattage and duration. |
|
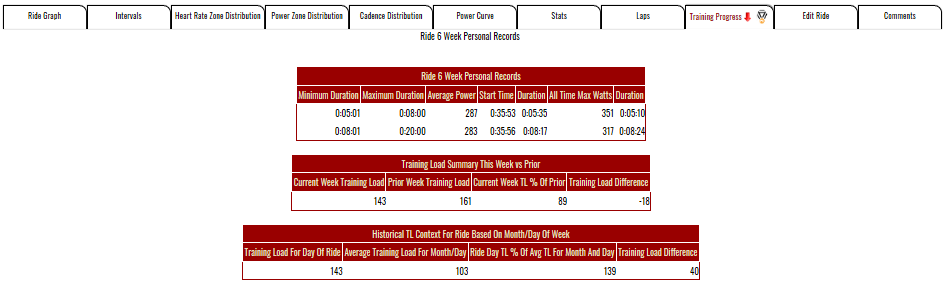
| Training Progress Tab KOM Informatics tracks best effort personal records in 18 different "time boxes" most of which correspond to standard interval durations prescribed by cycling coaches. This tab keeps the cyclist apprised of any 6 week personal records attained on the ride which is a pretty good sign of progress. Most times though rides are about building a foundation for those peak efforts through progressive overload during the build phases of a training cycle. The latter 2 tables on the tab help with this task. Training Load Summary This Week vs Prior lets you know if you're ahead or behind last week's training load based on the day of the week. If you're behind, and it's supposed to be a build week in many cases you can get your week back on track. Historical TL Context For Ride Based On Month/Day Of Week lets you know how your ride compares to other rides on the same month and day. Sometimes it helps to be inspired by stronger rides done in past seasons! |
|
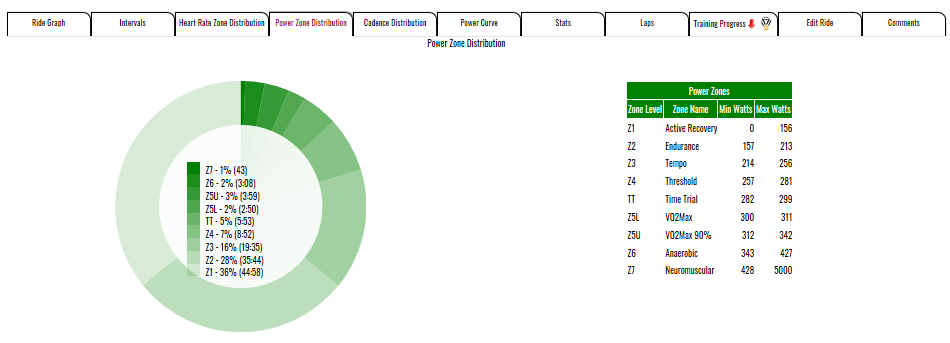
| Power Zone Distribution Tab Pie chart breakdown of watts by power zone for the ride |
|
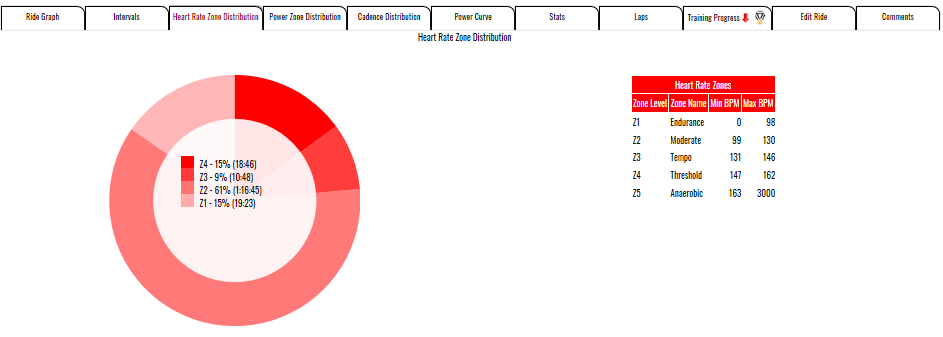
| Heart Rate Zone Distribution Tab Pie chart breakdown of BPM by zone for the ride |
|
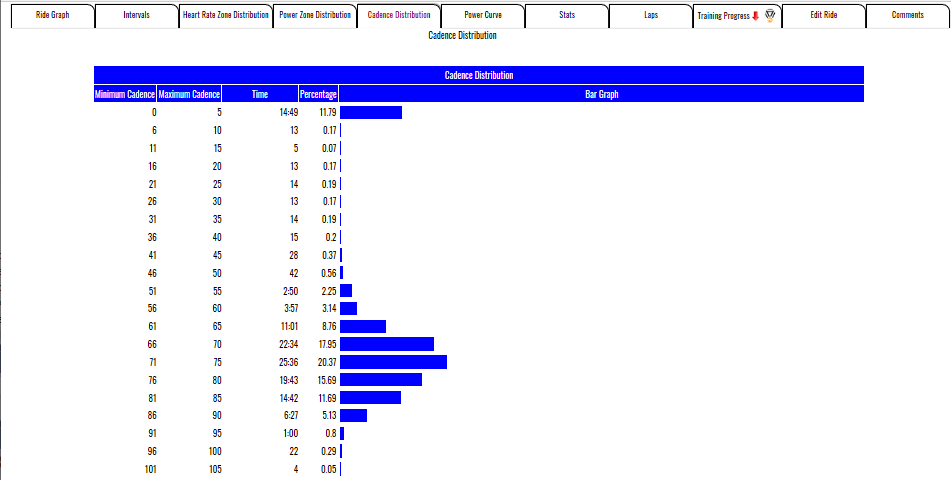
| Cadence Distribution Tab A bar chart showing Cadence distribution breaking every 5 RPM. |
|
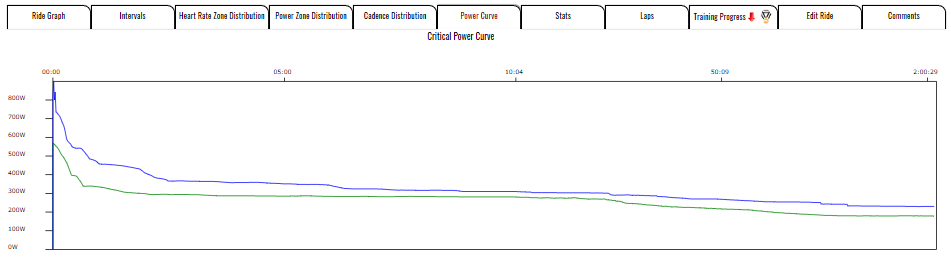
| Power Curve Tab A chart showing maximal powers for various durations across the ride vs all time bests. (Duration intervals start at one second and get progressively larger as the ride gets longer) |
|
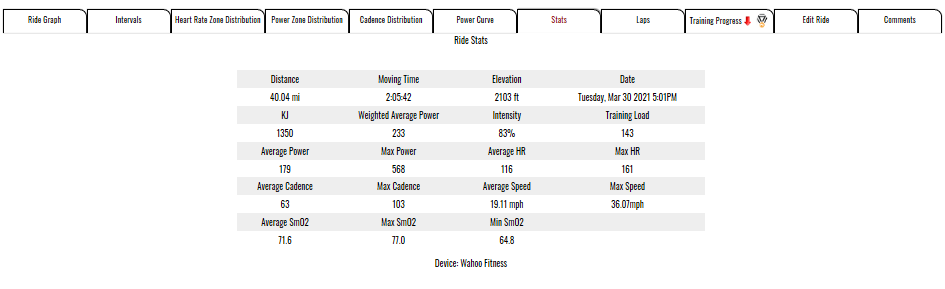
| Stats Tab Shows ride details. |
|
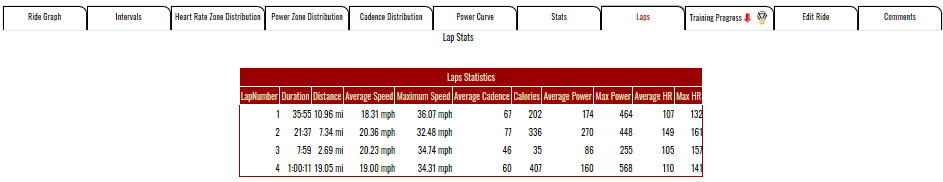
| Laps Tab Shows details by lap. |
|
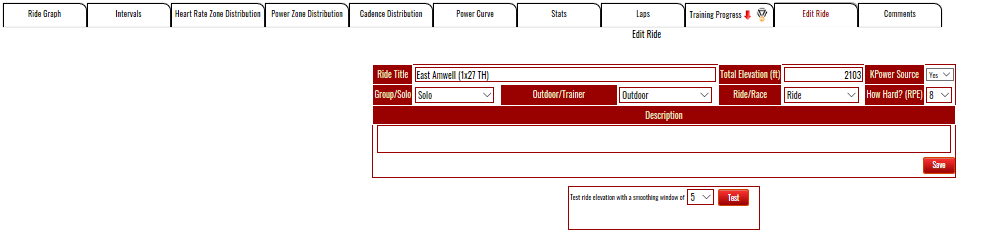
| Edit Ride Tab Provide a name for the ride and any comments. Classify the ride. |
|
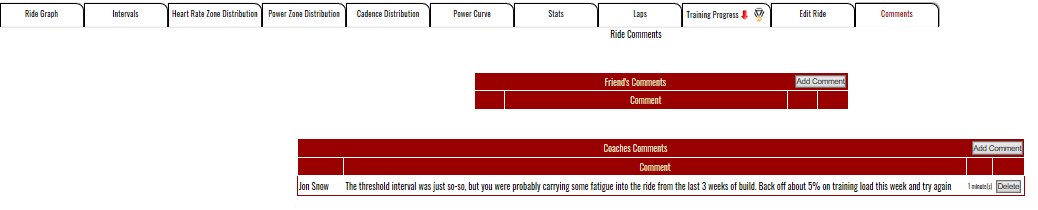
| Comments Tab See and reply to comments from both Friends and Coaches on this tab. Friends won't see your Coach's comments. |
|
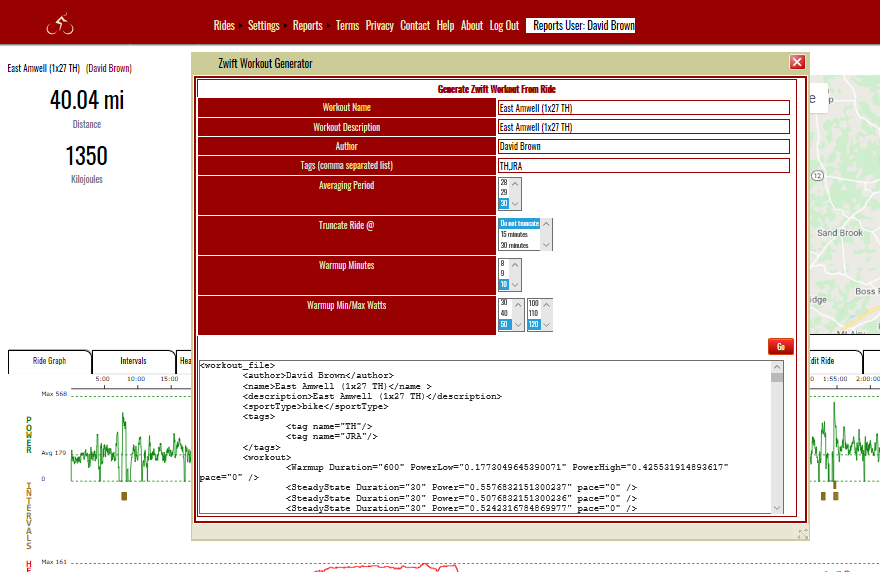
| Zwift Workout Generator Turn your ride into a Zwift workout! Copy and paste the workout from the textarea into a text file and save it with a .zwo extension in the workouts folder under your Zwift installation and you're good to go. Workouts generated from outdoor rides have a lot more watts variability then a typical trainer ride, and can help with transition from the indoor to the outdoor season. |
|