Home > Reports > Power Curves
Power Curves
The Power Curves report allows you to generate 2 mean maximal power curves for comparison. Each curve can represent an individual ride or a date range. The report also serves as an entry point to generating Critical Power graphs.
- From the main menu click the {Reports} {Critical Power} {Power Curves} menu selections.
- The Power Curves Report page will appear.
- If you've setup different bicycles in the system, you can select the bicycle for which you want to generate power curves for. After you make a selection, the screen will update, and only those rides using the selected bicycle will appear. Date range based power curves will also respect the selected bicycle
- Decide what you want each curve to represent, and then click either the Generate Curve For Ride or Generate Curve For Date Range radio buttons at the top of the page depending upon your choices.
- If you selected Generate Curves For Ride, then click on a ride from the corresponding Rides dropdown list beneath the radio button.
- If you selected Generate Curves For Date Range, then type in Start and End Date (or use the Calendar popup)for the range in MM/DD/YYYY format in the areas provided beneath the Rides dropdown list. (Display the popup by clicking the Calendar button to the right of the input textbox for a date).
- Once you've finished your selections, click the Generate Curves button to generate the curves.
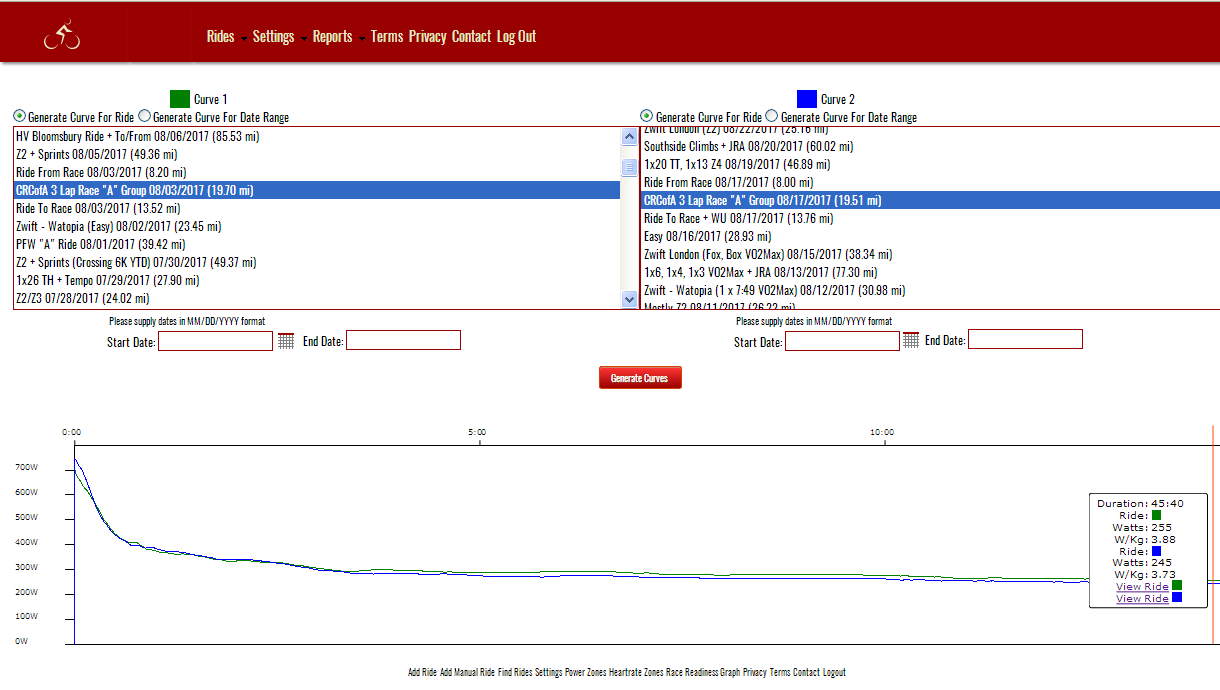
- The Curves will be displayed beneath the controls area. Curve 1, representing the choices from the left hand side of the screen will appear in green, Curve 2 representing the choices from the right hand side of the screen will appear in blue.
- Hovering over the graph with the mouse displays an InfoBox with the Watts and Watts/Kg for the given duration, for each curve.
- Clicking on the graph freezes the InfoBox and allows you to click either of the links back to the effort's ride, which appear in the InfoBox.
- In the InfoBox, the watts for each selection are hyperlinked. Clicking on the hyperlink will cause the Watts/Duration to be selected as a Critical Power trial. The trial will appear in the Critical Power section of the screen beneath the graph.
The image below depicts the bicycle dropdown select

The image below depicts a graph which compares 2 road races, run on the same course, on different days.

See also