KOM Informatics: Critical Power
History
Critical Power (CP) is a theory in exercise physiology which holds that the boundary between the heavy, sustainable, and the severe, unsustainable exercise domains can be determined through one or more trial efforts and some statistics.
The theory has been around for a while. Proponents trace it's roots all the way back to 1925 to a paper by Professor A.V. Hill, University of London called The Physiological Basis Of Athletic Records"
Perhaps the most important boost to the theory in more modern times came from a paper called "The Work Capacity Of A Synergic Muscular Group" by Monod and Scherrer published in 1965. There have been many studies involving the concept since then. It's safe to say CP has been extensively studied and refined
Theory
The theory posits a linear relationship between the energy output of a cyclist and the duration over which he or she is working. Under the two parameter model implemented in KOM Informatics, a regression line using the trial efforts as inputs is calculated using the ordinary least squares method. This method yields the slope and Y intercept of the equation of the line plotting kilojoules on the Y axis and duration on the X axis. The intercept equates to Anerobic Work Capacity (AWC). Once kilojoules and duration are known it's not difficult to calculate watts for any second. The hyperbolic, smooth power duration curve that appears in graphs of Critical Power is the end result of this process
The CP 2 parameter model is generally held to be invalid at shorter durations where predicted power approaches infinity. Similarly, the model predicts a asymptotic power level which can be maintained for an infinite amount of time. Common sense would seem to indicate the theory should be restricted to a more narrow time range.
Trial Recommendations
So, what about those trial efforts? Here are some "best practice" recommendations from Dr. Andrew M. Jones from his paper in his paper The maximal metabolic steady state: redefining the ‘gold standard’:
With respect to duration: "It is essential that subjects give their maximum effort in each trial and that cadence is consistent across all trials. Ideally the shortest trial should be 2–3 min and the longest should be more than 10 but no longer than 15 min (Hill 1993; Vanhatalo et al. 2011a). It has been recommended that there should be at least a 5 min difference between the shortest and longest trials (Bishop et al. 1998) but the goodness of hyperbolic fit is improved by making the range of times to exhaustion as broad as possible (i.e., 8–12 min) within the severe-intensity domain. The precise duration of the prediction trials is of secondary importance to the attainment of VO2max, but it is unusual for VO2max to be attained if exercise duration is shorter than 1–2 min or longer than 15–20 min (Hill et al. 2002; Vanhatalo et al. 2016). "
With respect to number of trials: " In practice, 3-4 (Smith and Jones 2001; Brickley et al. 2002; Pringle and Jones 2002; Dekerle et al. 2005; Black et al. 2015) or 5-7 (Hughson et al. 1984; Gaesser and Wilson 1988; Poole et al. 1990; Bull et al. 2000; Vanhatalo et al. 2007) trials are commonly used. "
Another physiologist Nathan Townsend, weighed in (in a Google Wattage forum post) on how to space the trials out, both within sessions and across days: "I definitely think that 2 max efforts in a day with appropriate recovery can be achieved. With that in mind, and following those criteria, my recommendation for standard CP testing are as follows: day 1: 14min TT -> 40min recovery -> 6min TT day 2: 10min TT -> 40min recovery -> 2min TT
This is not part of Townsend's recommendation, but older athletes may want to consider allowing an extra recovery day between day 1 and day 2
Uses
CP can be used for several different things:
- Figure out target wattage for a non-standard interval duration.
- A time trialer could use shorter tests to figure out a target wattage for a longer TT effort
- You could compare CP curves from different dates to get an idea about
changes in fitness - If you see an area in the CP curves which is above your maximal effort best this
could indicate an area which could use some improvement. - The KOM Informatics UI allows you to change the wattage of prediction trials. This allows you to investigate "what if" scenarios involving changes to
one or more parts of the CP curve affecting other parts of the CP curve. - You could use your CP 60 (CP @ 60 minutes) number in place of FTP to calculate power training zones. To be on the safe side we would use CP x .97, since for many it seems that CP is a little
higher then FTP
How well does CP predict performance?
So, how well does it actually work at predicting power at various durations? Dr. Andrew M. Jones weighs in on the topic in his paper The maximal metabolic steady state: redefining the ‘gold standard’: "the time to the limit of tolerance when subjects are asked to exercise at CP is highly variable (e.g., range of approximately 15 to 40 min or occasionally up to ~60 min; McLellan and Cheung 1992; Bull et al. 2000; Brickley et al. 2002; McClave et al. 2011; Bergstrom et al. 2013), with the group mean physiological responses being characteristic of either heavy-intensity (Poole et al. 1988, 1990; Wakayoshi et al. 1993) or severe-intensity (Jenkins and Quigley 1990; McLellan and Cheung 1992; Brickley et al. 2002) exercise."
So, the theory has at first blush, what seems to be mixed results. Jones weighs in with an explanation: "The approaches used to model CP will naturally be associated with some error (which is quantifiable, e.g., as standard error or 95% confidence intervals) and Tlim and CP will vary a little in any individual from day to day (i.e., there is some inherent biological variability; Poole et al. 1988)". So it's not surprising that there is this much variability in outcomes when subjects are required to exercise at an exact CP wattage. The KOM Informatics implementation of CP calculates both the standard error of the estimate, and the standard error of the regression.
The internet has some examples where CP has accurately predicted time trial performance. Here's a paper which documents successful predictions for 2 cyclists competing at the British Championships: Critical Power And Aerodynamic Drag Accurately Predict Road Time-trial Performance In British Champion Cyclists
How well does CP predict performance?: Some Personal Examples
As an amateur competitive time trialer I was naturally curious as to how well CP would have predicted some of my past performances. Although I didn't do formal trials I did make it a practice to regularly include interval work in the prescribed durations. The interval work was generally close enough to maximal effort to make using for it for CP predictions interesting.
Building a CP graph in KOM Informatics involves picking the trials from mean maximal power curves limited by date range. For all of the examples presented here I used the 30 days preceding each event as the time frame, so as to be sure to get viable trials over prescribed durations. For each of these examples I used 3,7,11 and 15 minute trials.
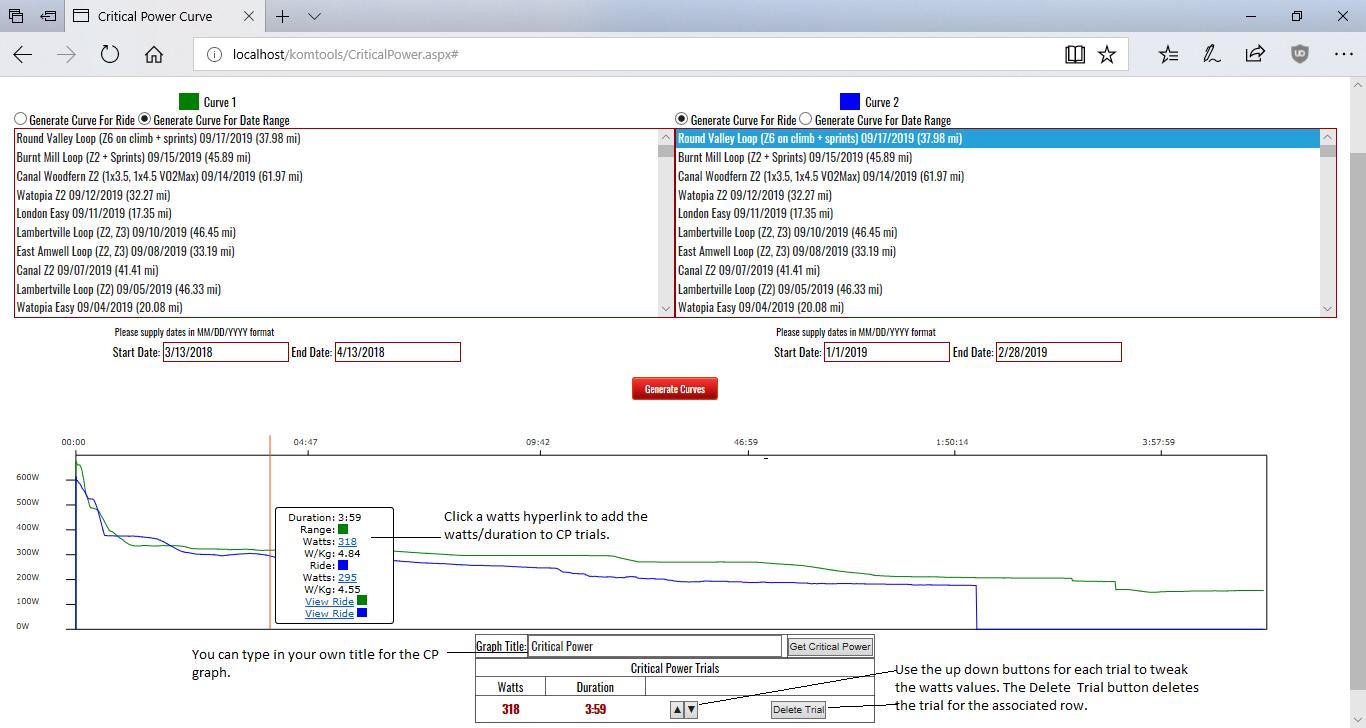
Here's a look at the UI in the system which also lets you select individual rides as well as date ranges. (Click on the thumbnail for a larger image)
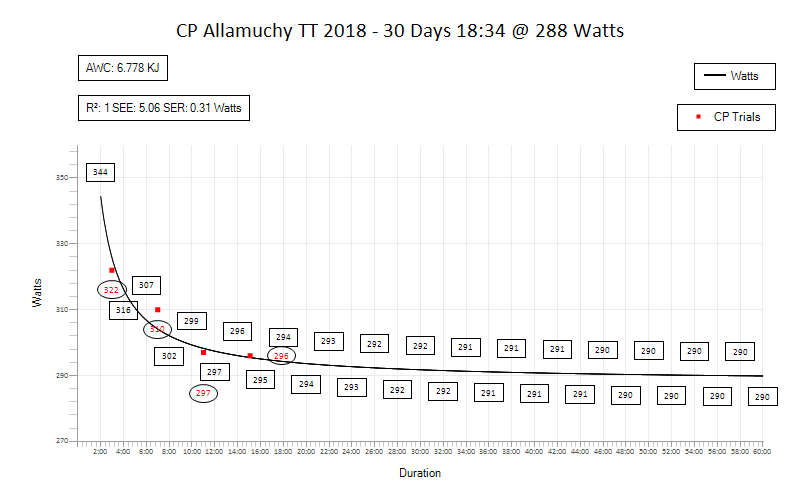
The first graph I tried was for the 30 days preceding the 2018 Allamuchy TT. I did this in 18:34 @ 288 watts, CP predicted 294 watts.
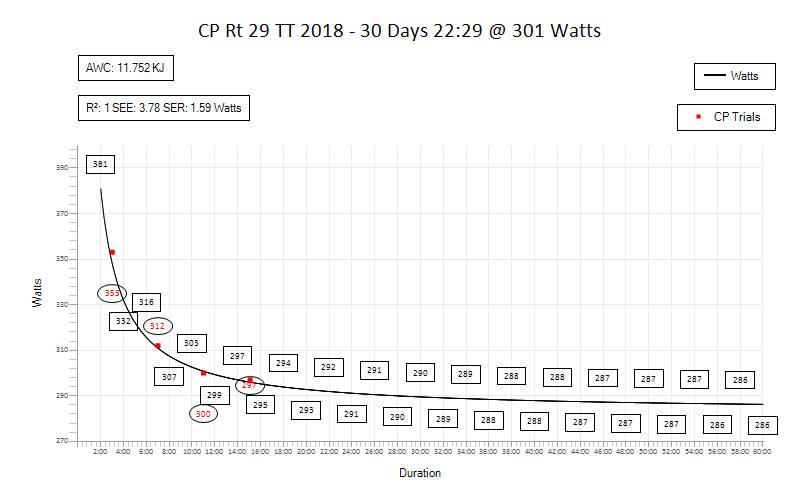
The next graph I tried was for the 30 days preceding the 2018 Rt 29 TT. I did this in 22:29 @ 301 watts, CP predicted 292 watts.
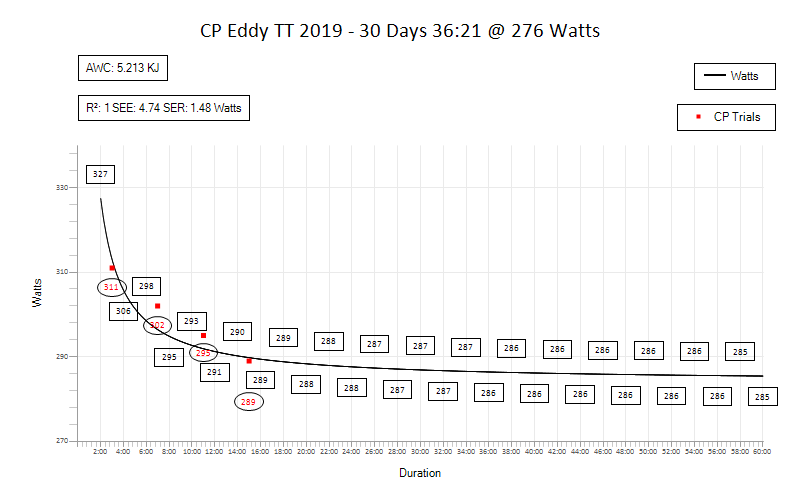
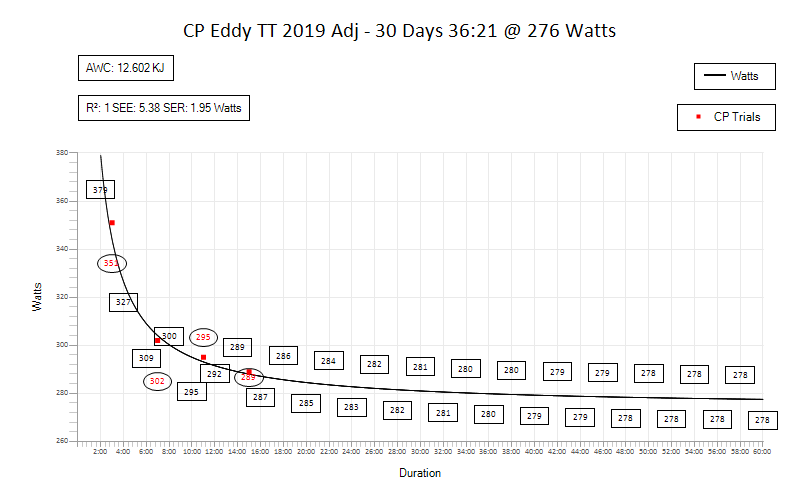
The last graph I tried was for the 30 days preceding the 2019 Eddy TT. I did this in 36:21 @ 276 watts, CP predicted 286 watts.
So, for 2 of the TT's I underperformed CP by 6 and 10 watts respectively. For the third, I overperformed CP by 9 watts. I took a little deeper dive into the data to try to figure out why.
The first thing I noticed was the discrepancy between the 3 minute wattages amongst the 3 examples, with the 3 minute trial preceding Rt 29 (353W) being substantially better then the other 2 (322W, 311W). Although it seems counter intuitive, a stronger trial at a shorter duration will pull down CP (while raising Anaerobic Work Capacity). I drilled down to the underperforming 3 minute trials and discovered they were both part of longer efforts, and thus sub-maximal. So, I tried raising the wattage on the 3 minute Eddy 2019 trial to 353 watts. This time CP predicted 280 watts, a fair amount closer to the actual 276 watts.
Next, I looked at the trials behind the Rt 29 TT in 2018. Both the 11 and 15 minute trials came from a single effort, a club TT the week of the race. The course contains several turns and some sharp, punchy hills. These factors hurt average power. It's likely that watts would have been higher on a flatter, less technical course. After "bumping" those trials up 10 watts (not showing the graph for this one), CP is predicted @ 302W, just one watt more then actual.
CP Takeaways
Overall I've been favorably impressed with the use of CP to predict TT wattage. However there are some caveats one should keep in mind before using CP predictions.
- CP trial terrain should mirror the terrain you're developing the prediction for as closely as possible
- The foregoing is even more important with respect to the shortest and longest duration trials. These trials have the ability to affect the slope of the regression line calculated more then the middle trials.
- From the standpoint of developing an accurate prediction it' probably better to follow the recommendation of the physiologists and have dedicated trial days. From the standpoint of best overall training it might be best to include the trial efforts within normal training over a longer period.
- It may be unfeasible in a particular circumstance to generate a perfect trial. When that happens, the rider or coach should have a good idea of the rider's capabilities to know which way to "tweak" the trial to develop the most accurate predictions.