KOM Informatics: Blog Home
2025
Secrets Of The High Responders Training Effectiveness Articles

Secrets Of The High Responders
The findings in all of the articles in our Training Effectiveness series have spotlighted interval training as the most effective way to achieve performance gains. However, coaches and experienced athletes alike know that interval training is usually limited to 2, or at most 3 rides a week. The problem then becomes, how to use those days without scheduled intervals to optimize training gains? The latest article in the Training Effectiveness series looks at all 2022-2023 data throught the lens of some commonly prescribed strategies. These athletes have already achieved 1 or more successful interventions, mostly through interval training. But which of these endurance focused strategies will put them into the ranks of the high responders, those athletes that are achieving greater watts gains than others in the cohort? Here is the link.
Secrets Of The High Responders - Interval Program Optimization
After an intervention ends, one of the problems that presents itself is how to continue to use intervals to optimize training gains. The latest article in the Training Effectiveness series looks at all 2022-2023 data in aggregate through the lens of total time, and total kj at interval intensity, along with the number of interval sessions for Z4, Z5, Z6 and Z7 intervals. Does putting in more time and more kilojoules at interval intensity imply correspondingly higher watts gain? Do more interval sessions in the study timeframe imply those athletes doing more will achieve proportionate watts gains? Which of these interval focused strategies will put them into the ranks of the high responders, those athletes that are achieving greater watts gains than others in the cohort? Here is the link.
2024
Build 3.62, Rider Phenotype training effectiveness article, July-December Training Effectiveness results

Training Effectiveness Results July-December 2024
KOMInformatics.com has calculated Training Effectiveness results for it's athletes for the latter half of 2024, based on the standard 28 day work time slice and 0 work end date offset.
For the latter half of 2024 athletes averaged an all time high 6.344 statistically significant workload/personal record correlations per user, 16% higher than the next largest result. The average watts gain across all 18 PR timeboxes was 59 watts, the second highest of all time.
Congrats to those that put in the hard work to deliver these significant results!

Build 3.62
The Power Curves/Critical Power screen now allows a selection of bicycle. This change benefits time-trialers who often won't be able to attain the same CP on a TT bike that they can attain on a road bike, enabling more precise watts targeting & pacing for TT's.
The Notifications list now has a [Mark All As Read] button.
Overview Of The Statistically Significant Correlations Between Workload And Performance 2022-2023 By Rider Phenotype
The latest article in the Training Effectiveness series looks at all 2022-2023 data throught the lens of Rider Phenotype. KOM Informatics Rider Phenotypes are derived from percentile ranks from all users from 12 PR timeboxes divided into 4 categories. We found that athletes were 3 times more likely to get stronger results from working on areas of relative weakness as opposed to areas of relative strength. Here is the link.
2024
Race Podium!, 2 week vs 4 week intervention article, statistically significant correlations overview article.

Race Podium!
KOM Informatics Lead Developer David Brown took 2nd place in the men's 65+ at the Long Valley Time Trial on July 20th.
Raising 20 Minute Power Over 4 Weeks And 2 weeks: What Actually Worked
This article is a follow-up to Raising 20 Minute Power Over 4 Weeks: What Actually Worked where we took a deep dive into 2 years of KOMInformatics data to discover trends of how people were raising 20 minute power over 4 weeks. Prior to this point, the articles have looked at only 4 week interventions, but we recently added 2 week interventions as well. This new follow-up article compares and contrasts the 4 week vs the new 2 week interventions.
Overview Of The Statistically Significant Correlations Between Workload And Performance 2022-2023
Prior articles in this series have only looked at data in the 20 minute to 1 hour PR time box, since increasing 20 minute power is a major focus for many competitive cyclists. But there are 16 other PR time boxes employed by the system in the Training Effectiveness report. This new follow-up article looks at Training Effectiveness data compiled from all of the PR time boxes.
2024
Race Podium!, Raising 20 Minute Power Follow-Up Article, Build 3.61

Race Podium!
KOM Informatics Lead Developer David Brown took 2nd place in the men's 65+ at the Watts Up Time Trial on June 8th.
Raising 20 Minute Power Over 4 Weeks: Interval Program Details
This article is a follow-up to Raising 20 Minute Power Over 4 Weeks: What Actually Worked where we took a deep dive into 2 years of KOMInformatics data to discover trends of how people were raising 20 minute power. The follow-up article looks at the successful interventions in more detail, including average and maximum interval durations and how interval sessions were distributed across the reporting period.

Build 3.61
The Training Effectiveness report now includes data on 4 new runs based on 6 month timeframes from 2022-2023. In contrast to those runs already covering those time periods, the new runs utilize a 14 day workload window instead of 28 days. This is meant to help optimize training decisions if you only have 2 weeks until your race or event. The Training Effectiveness dropdown select now includes the workload window and offset to distinguish runs covering the same data range.
Also, the Training Effectiveness list includes a new column, Watts Gain which details the gains from the earliest PR to the latest PR in the report timeframe. This additional data point is meant to help the athlete decide what interventions are optimal for them at the time the report is run.
2024
Race Podium, Raising 20 Minute Power article, Build 3.59

Race Podium!
KOM Informatics Lead Developer David Brown took 3rd place in the men's 55+ at Skylands Cycling's 2024 High Point Hill Climb on May 4th. Brown had to overcome some adversity after flatting on the descent to the start line with limited time to fix the flat and warm up. The 55+ field was stacked combining what had been run as 3 fields in past versions of the event.
Raising 20 Minute Power Over 4 Weeks: What Actually Worked
We took a deep dive into 2 years of KOMInformatics data to discover trends of how people were raising 20 minute power. Take a look at the article for the findings.

Build 3.59
A new Adaptations Comparison Analysis, new workout export formats.
The new Adaptations Comparison Analysis can be found on the Six Week Comparison report available on the Race Readiness Graph. The analysis builds off the approach outlined in this article. Rather than list all 13 adaptations, it groups them into aerobic and anaerobic categories, and averages them. Period 2 training values are characterized as a percentage of Period 1 values. This is a little more granular way to look at workload differences as opposed to training load and can be helpful explaining performance differences when different strategies are used to build fitness.
The build also includes 2 new export formats for workouts, .mrc and .erg.
2024
Build 3.54

Build 3.54
A new Training Load To Critical Power Correlation Analysis.
How well does your long-term training load correlate with your Critical Power @ 50 minutes (CP50)? Assuming CP50 gains are a goal for you, a Strong Positive correlation (>.5) may indicate your training has you on the right track. Conversely, less than a Strong Positive correlation may indicate you need to change up your training intensity distribution, or possibly that you are not making the maximal 11-14 minute efforts needed to score well on CP evaluations.
The analysis provides your long-term training load to CP 50 correlation. It checks for a couple of common issues, understated FTP/Power Zones, and a lack of of maximal 11-14 minute efforts. It then looks at your training in terms of average weekly time, and average weekly interval time in comparison to athletes from the Strong Positive group.
The new analysis can be found on the Plan Strategy page under the Workouts main menu selection.
Working With Adaptive Workouts - 2024 Q1 Build
Curious about what it's like to work with Interval Advisor and Adaptive Workouts long term? Here's an article that covers working with the system over 3 months to manage a build for the 2024 season.

A Z2 Heavy Strategy: Trading Time For Adaptations
There's been a lot of discussion about Z2 training lately in the cycling press, a lot of it fueled by Z2 advocate Iniago St. Millian, who has coached the wildly successful Tadej Pogacar. But how viable is a Z2 heavy strategy for most cyclists? In the end, there are probably going to be as many answers as there are cyclists, depending on goals, training preferences and time constraints. This article explores my attempt to answer the question for myself, using a data-driven approach.
2024
Build 3.48, Build 3.51, Build 3.53
Build 3.48
Based on user feedback, each Adaptive Workout now has 15 versions which have the same intervals but different options for warmup and cooldown, accomodating different schedule constraints and training plan volumes. There are 3 warmup options: Short (10:00), Medium (20:00) and Long (28:03). The cooldown options are: None (0:00), Short (15:00), Long (45:00) and Long+ (60:00).
The feedback system with respect to Adaptive Workouts has been enhanced. If you fail to meet interval projections for an Adaptive Workout, and try the same workout within the next 10 days, you'll be given the same workout to try again.
Build 3.51
Devising workouts can be especially challenging when athletes perform those workouts on different bicycles and/or different environments. It's quite common to not to be able to perform intervals as well on a TT bike vs a road bike, or indoors on a trainer vs outdoors.
KOMInformatics.com version 3.51 mitigates these issues. The notion of different bicycles has been brought into the application. Every user has been set up with a default bicycle. There is a new settings screen where the name of the default bicycle can be changed, and new bicycles added. This capability can be used to reflect differences in environment, e.g. you can set up a "Road Bike", and a "Road Bike (Indoors)". On the Edit tab of the ride page you can tag your rides with a bicycle from a dropdown list.
On the Interval Advisor screen the user now has the capability to recalculate statistics based on a bicycle selection. Recommendations will be based on the current set of statistics, which in turn reflect the user's capabilities on that bicycle.

Build 3.53
Workouts can now be exported in .fit format which greatly extends the range of devices that support them.
Athletes have the opportunity to control the watts range in exported .fit files. The files will respect the workout wattages in the low watts of workout blocks, where the range sets the upper limit.
For example, if the workout calls for a block of 200 watts, the athlete can select a watts range of anywhere from 5 watts (200-205 watts) to 30 watts (200-230 watts). This allows greater flexibility to account for differing capabilities of trainers implementing ERG mode, as well as individual preferences.
2023
Build 3.44. Adaptive Workouts
Build 3.44
Interval Advisor has a new Adaptive Workouts feature. Interval Advisor is a rules based AI recommendation engine that prescribes total interval duration for an interval session based on a selected training zone.
Athletes should generate an Interval Advisor recommendation on the day they plan to do an interval session, prior to their ride. After doing this, users can select from a list of Adaptive Workouts, that feature interval sessions based on the selected training zone. Clicking the [Generate] button will generate a workout tailored to their Interval Advisor recommendation.
The generated Adaptive Workout is much the same as any other workout in the system. Users can generate projections (Overall KJ and Interval KJ/Durations) for the workout, and add the workout to their schedule.
It will be possible to pinpoint Interval KJ for the featured training zone, for a given workout against the overall Interval KJ for a time period. If athletes use a single workout for a featured training zone for an intervention period, they should be able to make some strong inferences about the efficacy of the workout for themselves, from the PR/Workload Correlation report already in the system.
Working With Adaptive Workouts
Adaptive Workouts? Here's an article that covers a 10 day intervention utilizing the Traditional Threshold Adaptive Workout.
Adaptive Workouts: Progressive Overload
2023
Race Wins, Build 3.40!

Race Win!
KOM Informatics Lead Developer David Brown took his AG top step at Team Somerset's 2023 Long Valley TT on July 15th. Brown credits the KOM Informatics system in ensuring that race fitness was there when needed. Brown said "The extreme heat leading up to the event made it difficult to log long training hours. The ability to concentrate on the most effective training provided by the KOMInformatics.com system proved to be a difference maker.""

Race Win!
KOM Informatics Lead Developer David Brown took his AG top step at the 2023 Watts Up Time Trial on July 27th by 35 seconds. The 8 mile event served as the NJBA's last official event of the year. Brown won his AG on 4 out of 5 starts in TT's this year, with the only miss a DNF.
Build 3.40
A new Interval Advisor Utility. Interval Advisor is a rules based AI recommendation engine that prescribes total interval duration for an interval session based on a selected training zone.
Interval Advisor considers many factors before providing a recommendation. It looks at literally hundreds of statistics regarding your performance over the past year generated on weekly basis, as well as your most recent session involving the selected training zone. Training context is an important factor as well. A recommendation for an athlete coming off an extended break will be very different for that same athlete had they been training regularly.
Athletes are encouraged to divide the recommendations provided by Interval Advisor into chunks of "on" time that are at least as long as the minimum specified on the Power Zones page, when planning an outdoor session. The athlete is the expert when it comes to choosing the best roads and terrain in their neighborhood for interval sessions.
Fully adaptive indoor workouts which use an Interval Advisor recommendation as a basis are coming in a future release! A way to record a recommendation, link it to a ride, and provide feedback is also on tap.
2023
Build 3.30, Race Wins!

Build 3.30
A new Plan Strategy Report. Plan Strategy helps athletes avoid mistakes that are sometimes "baked-in" to pre-made plans, and make more optimal decisions implementing training plans.
Zone Compliance & FTP/CP Alignment
More than a few athletes have an issue with incorrect training zones. A training plan can quickly derail if workouts are built around zones that are too easy or too hard. The vast majority of KOM Informatics workouts are based on a 7 zone schema, based on a percentage of FTP. The software checks for compliance with the schema for zones 2-5. If the training zones are compliant with the latest FTP you've provided, than how well does this FTP align with tested critical power over the last month? If the software reports that FTP is substantially overstated with respect to tested CP it means that the athlete hasn't been making the type of longer efforts that impress the CP algorithm. In this event the software will test for the presence of Z4 and Z5 intervals within the last 4 weeks. If the athlete is still performing these types of intervals, this is pretty good evidence that the zones they are based on are still ok.
Plan Tapering Strategy
Your plan may result in high fitness for your big event, but you still may need some guidance as to how to taper for optimal results on race days. This section looks at your rides both 1 and 2 days before your PR's for the past year were set and looks at average moving times and kj expended, average interval times and kj expended, along with what percentage of those days involved total rest. There are a lot of individual differences here! Learning how you attained a PR in the past allows you to apply that strategy again in the future.
Back-To-Back Interval Day Tolerance
Inevitably work and family obligations can sometimes derail a training plan. Sometimes we are forced to try to space workouts on back-to-back days to ensure that all prescribed workouts for the week are accomplished. It's problematic for many of us when these back-to-back days involve high intensity intervals. This section looks at each day within the past year where your interval workload was above average, and examines whether or not you were able to manage yet another above average interval workload day on the day after. If you were able to manage this more than a few times, then back-to-back days in the upcoming schedule should be manageable. If you weren't able to manage this, then perhaps consider another type of workout for the second day.
Plan Workload Takeoff Point
The onset of any training plan needs to be aware of the athlete's current workload tolerance. The table directly below looks at the last 6 weeks of training and shows average moving time, training load, and ramp rate along with max training load. Any new plan adopted shouldn't incorporate significantly more or less workload than shown here.
Prior Season Peak Build Analysis
This section looks at the 12 weeks of training prior to last season's peak and shows average moving time, training load, and ramp rate along with max training load. Assuming they didn't result in overtraining, these numbers can be used to establish a floor of what the athlete can tolerate in terms of workload and ramp rate. Did the training prior to peak result in PR's? If it didn't then it wasn't very effective. This could mean the athlete was overtraining, or the composition of the training wasn't right to achieve goals, or that the athlete was close to their genetic potential. The section further looks at the percentage of PR's achieved during the peak period, and the PR details.

Race Win!
KOM Informatics Lead Developer David Brown took the top step at Team Somerset's 2023 Allamuchy TT on April 15th. Brown credits the KOM Informatics system in ensuring that race fitness was there when needed. Brown said "Even though life events and bad weather led to less overall training load in early 2023, the knowledge the system affords regarding what training is statistically effective made up for it. The training I did get done created adaptations favorable for TT events."


Race Win!
KOM Informatics Lead Developer David Brown took his AG top step at 2023 Kingwood Time Trial on May 27th by over a minute. The 17 mile event served as the NJBA's State Championship TT. The event was Brown's 3rd State Championship where his training was informed by the KOM Informatics system. "The system lets me know what aspects of my training yield statistically significant result against my PRs. Concentrating on effective training created favorable adaptations for TT Events."
2022
Race Win!

Race Win!
Congrats to KOM Informatics power user Fedor Wouda on his 1st place finish at Croton Cross!
2022
Build 3.28, Race Podium!, Build 3.29

Build 3.28
KOM Informatics has released Beta Build 3.28. Changes include:
A new Zwift Workout import utility
A new Zwift Workout import utility. Now you can import your existing custom .zwo Workout files into
KOM Informatics to take advantage of the system's Projections, Scheduling, and Workout Performance Reports.

Race Podium!
Congrats to KOM Informatics power user Fedor Wouda on his 3rd place finish at Bubble Cross. Fedor overcame significant adversity in that he flatted a tire on his cross bike during warmups, and had to use a mountain bike for the race itself. Despite a substantial weight penalty Fedor still ended up on the podium!

Build 3.29
KOM Informatics has released Beta Build 3.29. Changes include:
A new Rider Assessment report.
This report has 2 sections.
The first section, Performance gives your percentile rankings
in Watts/Kg vs other KOM Informatics users in 12 different durations divided into 4 categories.
Your percentile rankings are limited by the Training Year you select. Since the data is from all ages and competitive levels,
absolute rankings shouldn't mean much to those who aren't aspiring to pro performance levels. Your relative percentiles are a
different matter. If your relative percentiles are off for a particular category or duration that is important to your
competive success, this might be a cause for concern. You might want to click the requisite W/Kg links to assess whether your
performance was truly a maximal effort. If so, you may want to do training to help that specific category/duration.
Your relative percentiles can be a strong indicator of the type of events that will bring you the best chances of competitive
success.
Running the report for all years, then the current year can also yield valuable insights. Are any of your rankings declining? If you have a particular category that shows a decline in the current year, this points out an area which could be addressed by changing your training mix.
W/Kg percentile data is updated on a daily basis. Judging by Dr. Coggan's powerprofiling_v4.xls spreadsheet, the top KOM Informatics male performances
are at Category 1 level for the 6-10s and 1:01 - 2 minute durations and International Pro for the 5:01 - 8:00 minute and 20:01-1 Hour durations.
This second section Workload looks at your past year's interval training workload based on the date you run the report.
Training workload is expressed in weight adjusted kilojoules which is the energy you've expended in a given zone divided by
your weight in kilograms at the time of the ride.
It will only be relevant for you if you've uploaded data for the entire time period.
Try comparing your percentiles for a given interval zone with the percentiles from the Performance section from the
duration(s) that the interval work is usually prescribed to help. For example, compare your Zone 5 workload percentiles to
your your percentiles in the 3:01 - 5:00 minute and 5:01 to 8:00 durations from the Performance section.
If your workload percentiles are significantly higher than your performance percentiles, this under-performance may be due to
genetic factors. It could also be due to your FTP/CP and zones calculated from that FTP/CP being less than your true FTP.
Zone 5 work reported by the system might not be eliciting typical Zone 5 adaptations as well as might be expected.
Conversely, if your performance percentiles are higher than your workload percentiles, this could point out an area where
genetic factors are working in your favor. It might also be the case that you are eliciting Zone 5 adaptations through
HIIT modalities such as 30-15's or Tabatas. In most cases this will show up as Zone 6 work.
Workload percentiles data is updated on a daily basis.
2022
Race Win!, Build 3.23, Build 3.27

Build 3.23
KOM Informatics has released Beta Build 3.23. Changes include:
New Training Effectiveness Report
Training Effectiveness analyzes your workload (both interval & non-interval) and Personal Records
data for a substantial time period and extracts those where a statistically significant correlation
between workload and performance was found.
Users will get an Insight Notification summarizing the number of correlations found when an
analysis run is completed. Analysis runs will occur every 6 months. The notification will contain
a link to the new Training Effectiveness Report where users can select a date range and return
the statistically significant correlation.
Here's an correlation from my data:
01-01-22 - 07-01-22 TT Interval KJ 20:01 - 1:00:00 r(3) = 0.9923, p < .05 (statistically significant)
It says that there was a statistically significant correlation between TT interval work (TT = aro FTP) and
my PR's in the 20 minute to 1 hour timebox. Since I do a fair amount of training in that range I'm
going to make the call that the training in that range had a causal effect on the PR.
Since this training was effective for me I might want to include more of it in my current training mix.
The Training Effectiveness report has buttons for each Correlation which allows you to run subreports which evaluate both
your PR and Workload for the reporting period vs the PR and Workload for your last 4 weeks of training.
If I have a race coming up where I can use enhanced performance from 20:01 - 1:00:00, and my current
PR for that timebox is less than the reporting period, and my current workload in the TT interval range
is less than the workload accomplished during the reporting period, then stepping up TT interval work
would likely be a good use of my training time.
Training in interval ranges that have been proven to be effective for a cyclist in the past can help
a cyclist optimize their potential.

Race Win!
KOM Informatics Lead Developer David Brown took the top step at Team Somerset's 2022 Flanders TT on July 16th. The race was Brown's first USA Cycling race since 2019 but Brown credits the KOM Informatics system in ensuring that race fitness was maintained. Brown said "Since I knew the exact mix of training that produced good results in past years the knowledge proved invaluable in building race fitness in 2022".

Build 3.27
KOM Informatics has released Beta Build 3.27. Changes include:
New Interval Workload Levels Insight Notification
Interval Workload Levels track a 42-day rolling average of kilojoules of energy spent in a given interval
training zone. They are tracked in exactly the same way as Chronic Training Load. In future builds,
the main use for Interval Workloads will be for workout planning decision support. The system will be able to
associate Interval Workloads with what got accomplished in terms of interval training on any given day.
If you managed x minutes of interval work when your Interval Workload Level was y in the past, that is a
strong preliminary argument that you should be able to accomplish x minutes again, provided your
current level is y. The Interval Workload Levels Insight Notification provides a this week vs last week view.
If you're attempting to build fitness your levels in one or more zones should be rising, provided you are
not employing a volume based Z2 only strategy. The new notification is timed to run just after the 2 Critical Power Notification on Mondays.
The build also includes a performance optimization for the Personal Records - Workload Correlation report.
2022
Garmin Backfill implemented. Notifications. Hammer Score Leaderboard. Insight & Warning Notifications. Critical Power History.

Build 3.13
KOM Informatics has released Beta Build 3.13. Changes include:
A new Ride Backfill Request Utility
Currently works with Garmin Connect data. This utility enables you to upload rides which
occurred before the date when you initially authorized KOM Informatics to access your Garmin Connect data. Load a year's
worth of data with a couple of clicks!
A new Ride Load Status Checker Utility
Allows you to check the load status of your rides by date range and status.

Build 3.17
KOM Informatics has released Beta Build 3.17. Changes include:
Notifications
KOMInformatics has a new notifications system which is currently working for social networking
follow requests and ride comments. The Coaches And Friends page has a utility which allows you to lookup other
KOMInformatics users by supplying the Firstname, Lastname, and Nickname under which they are registered, and send them a follow request.
This utility is intended for those who have signed up through a recommendation from a coach or friend and want to be able to follow/
be followed by this individual. You get your notifications by clicking on the bell icon on the right side of the menubar.
An unread notification summary will be sent out by email. You can control the frequency that these emails are
sent from the Advanced Settings page. The default is once a day.
Weekly Hammer Score Leaderboard
This Leaderboard will show summary stats of the 5 toughest interval rides posted
on KOMInformatics for a given week, plus your best interval ride from that week if you didn't make the top 5.
Hammer Score is a metric that gets posted for every ride which calculates the
strength of the interval portion of the workout. It factors in both the FTP/CP and the body weight of the rider
theoretically making it a fair competition provided people are honest about their power zones, FTP/CP and weight.
You must opt-in to the Leaderboard in order to see it and be eligible to win the competition. You do this from
the Advanced Settings page, If you do opt-in your name will appear next to your score and other users will be able to
send you a "friend" follow request. If you accept a follow request that person will get your rides in their feed and be able to post comments on them.

Build 3.19
KOM Informatics has released Beta Build 3.19. Changes include:
Insight Notifications
Insights are a special type of system generated notification backed by a deep dive into your ride data, which will provide a basis for enhanced training decisions.
The first insight will provide a weekly look at your Critical Power (CP) and Anaerobic Work Capacity (AWC) based on your last 4 weeks of rides. Gains in CP equate to stronger TT's and an enhanced ability to hang in a bunch with stronger riders for long, sustained efforts. Gains in AWC equate to enhanced ability to make selections or create breakaways over the course of a race. It'll come into play when a race repeatedly hits short, punchy climbs.
Is the type of fitness you're building appropriate for your short to mid-term goals? Staying on top of your CP/AWC can help to answer that question
The first weekly CP Notification will occur on Monday 7/11/2022.
Warning Notifications
A Warning is a special type of notification generated by the system and backed by a deep dive into your ride data. They are meant as a strong suggestion that 1 or more of your KOM Informatics settings need to change. The first warning detects whether your latest FTP/CP recorded in General Settings is misaligned with your latest CP detected by the weekly CP check.
Critical Power History Backfill Utility
This utility generates Critical Power History for a given year of rides that occurred prior to a user's system signup date.
Critical Power History Report
This report allows you to select a date range and generate a graph for that date range for your Critical Power History data.
2022
Workouts, Workouts Projections, Workout Performance Reports implemented. Race podium.

Build 2.93
Beta Build 2.93 was released to production on 2/5/2022. This build features a new Workout Builder utility. Users can design workouts by configuring blocks which appear on the Workout Graph area of the screen. Commonly used or complex block patterns can be saved to the database as a Workout Component. Saved Workout Components appear on a panel and can be inserted into a future workout with a button click. The workouts can be generated into a .zwo (Zwift workout file.) Workouts can either be saved with a "public" or "private" access type. Public workouts are available for all users to view and generate Zwift workouts from. Private workouts can only be viewed by the workout's author or by the workout author's coached athletes.

Race Podium!
Congrats to KOM Informatics power user Fedor Wouda for his
second place finish at the NJ Mtb State Championships!!:

Build 2.99
Beta Build 2.99 was released to production on 4/2/2022. This build integrates the Workout Builder utility first released in Beta Build 2.93 with other aspects of the system.
Users can now generate Workout Projections for a Workout which describe the fitness implications of performing that workout. Projections include Average Power, Weighted Average Power, Intensity, Training Load, Kilojoules, and Interval Kilojoules. The Projection also includes Intervals, and an Interval Zone Distribution.
Users can schedule a Workout from that Workout's Projection. Scheduling the Workout saves the Projection and causes the Workout to appear on the Rides Calendar. Rescheduling the Workout or deleting the Workout from the schedule is accomplished on the Calendar.
Uploading a Ride on the day a Workout is scheduled for causes a new button [Workout Performance Report] to appear on the Ride page. If there is more than 1 Workout scheduled for that day all of the Workouts scheduled for that day appear on a dropdown list. Clicking the [Workout Performance Report] button after selecting the Workout from the list causes the report to display. (If only a single Workout is scheduled for a day the dropdown list won't appear, the Workout will be selected by default.)
The Report compares the Projections for the Workout that were made at the time you initially scheduled the Workout to what actually was accomplished on the Ride. If the Ride exceeded the Projections to a large degree this suggests that the next Workout you schedule targeting the same energy systems as the Workout under discussion could be a fair amount more difficult. If the Ride exceeds Projections by a small amount or the Ride and the Projections are roughly equal this suggest either making the next Workout a little harder or doing the same one. If you didn't hit the targets prescribed in the Workout, next time dial back the Workout a little bit.
2021
Automatic Ride Sync through Garmin Connect implemented.

Zwift Workout Generator
So it's 38 degrees and the winds are howling at 18mph? For most people, myself included that means a trainer ride. Many of us, particularly those of us with classic trainers often fall into the "metronome" syndrome - they'll pedal the entire ride at the same pace. On this type of ride average and weighted average power are very close to each other. That's bad news in terms of generating training load for the hours expended. KOM Informatics, in conjunction with the Zwift platform provides a way to mitigate the metronome syndrome. The Zwift Workout Generator utility bottles the high variability fitness magic found in outdoor rides by sampling the ride's wattages at a averaging period you can set. (30 seconds works pretty well). The efforts you made on your outdoor ride will be pretty well represented in your Zwift workout. There are options to include a warmup period in the workout, and you can tell the utility to truncate your outdoor ride in the generated file to fit your workout in to any time constraints you might have. To run the utility first navigate to the ride page you're interested in. 1. Click the [Generate Zwift Workout] button underneath the hammer icon on the main section of the page. The Zwift Generator Dialog box will appear 2. Fill out the text inputs and make selections from the dropdown lists as you see fit. (30 seconds works pretty well for an averaging period. 3. Click the [Go] button to generate the Zwift workout. It will appear in the textarea in the lower part of the dialog. 4. Copy and paste the workout into a text file. Save the workout (with a .zwo extension) in your Zwift\Workouts\nnnnn directory where "nnnnn" represents your Zwift Id. (This is easy to recognize once you navigate to the Zwift\Workouts folder). For Windows 10 Zwift is installed by default in the Documents directory. Make sure you do this before starting Zwift! 5. If you end up deleting a workout from the nnnnn directory don't try to save another workout with the same name to that directory. Zwift won't recognize it. Your new workout should be available for selection the next time you run Zwift. If you're not familiar with Zwift workouts, wattage changes are prompted by visual cues. It's fun and engaging to workout this way. So how well does it work? When I did this workout on Zwift I could see plenty of spikes and variability which led to a 20 watt difference in average/weighted average power (181/201), pretty close to the original ride (178/219). Mission accomplished!

Build 2.91
Beta Build 2.91 was released to production on 12/1/2021. This build includes integration with the Garmin Connect API enabling the syncing of rides on your Garmin device with your KOM Informatics account. After a 1 time setup where you authorize KOM Informatics to access your rides in Garmin Connect, your rides will be uploaded automatically!

Broke My Trainer!
My CycleOps Super Magneto Pro trainer was forced into honorable retirement by many tough KOM Informatics inspired interval sessions! Keep grinding and you too can force an upgrade on yourself! :)
2021
Automatic Ride Sync through Wahoo Cloud API implemented. Calendar implemented.

Build 2.77
Beta version 2.77 was released to production on 9/23/2021. This build includes integration with the Wahoo Cloud API enabling the syncing of rides on your Wahoo ELEMNT with your KOM Informatics account. After a 1 time setup where you authorize KOM Informatics to access your rides in the Wahoo Cloud, your rides will be uploaded automatically!

Hammer Score
Do you want to compare the difficulty of one interval session to another? Do you want to figure out if your interval sessions are harder then your training buddy's? The KOMInformatics Hammer Score can help with these questions. You can find the hammer score front and center on a KOMInformatics ride page. Hammer Score is a formula which is meant to show the difficulty of the interval portion of the ride, which takes cyclist weight into account. The formula is: RideIntervalKJ * ((AverageIntervalWatts/FTP)/Weight(Kg)). The Weight(kg) is brought into the formula to even things out between cyclists of different weight, all other things being equal, a heavier cyclist will generate more power then a smaller one. AverageIntervalWatts is brought into play to favor those rides which have intervals in the top power zones. Hammer Scores might be a good way to bring the element of competition into the KOMInformatics system.

Build 2.83
Beta Build 2.83 was released to production on 11/10/2021. The build includes a new Rides Calendar page which initially displays your rides for the current month on a large calendar. Clicking the left facing arrow button displays the rides for the previous month. You can also select a month/year from a select control and the page will display that month's rides on the calendar. Calendar popup support has been added for the Ride Feed, Personal Records, and Power Curves pages.
2021
Race wins. Fitness Signature.

Ride Page: Training Progress
If you keep doing the same rides over and over you will only get so fit. In order to keep improving you either have to make your rides longer, harder or better yet both! Making these changes gradually and intelligently utilizes a training principle called progressive overload. Cyclists are fortunate to have power meters and well-established formulas for logging training load. Most analytics systems have graphs derived from Roger Bannister's TRIMP (training impulse) system which show fitness, form, and fatigue. The KOM Informatics version is called the Race Readiness Graph. On the Race Readiness Graph you can see pretty easily if your fitness is trending up or down, but it's hard to tell whether or not for any given day whether you are ahead or behind last weeks efforts in terms of training load. If you're behind progressive overload is not happening! KOM Informatics has a another tool that clarifies the situation. A tab on the Ride Page called Training Progress keeps you apprised. Looking at the tab itself, an upwards facing green arrow means you are making progress over last week, where a downwards facing red arrow means the opposite. Clicking into the tab you would look at the Training Load Summary This Week vs Prior table which lets you know if you're ahead or behind last week's training load based on the day of the week. If you're behind, and it's supposed to be a build week in many cases you can get your week back on track. Building and maintaining awareness of your current training load situation is yet another way KOM Informatics distinguishes itself from the competition.

Race Wins!
Congrats to KOMInformatics user Fedor Wouda for his
2 recent race wins!!:
7/18/2021 MTB: The Bulldog Rump, Cat 2 Masters 45+
7/31/2021 MTB: Challenger XC, Cat 2 50+:
Fedor had this to say about the app in a recent Strava post:
"To all riders interested in analyzing their training to improve results. KOM Informatics
provides a lot of insight in training load, interval training, fitness, fatigue and form.
I've been a beta user for a couple of months and I have nothing but good things to say about it."

Build 2.64
Beta version 2.6.4 was released to production on 8/12/2021. The build includes the new Fitness Signatures report. A Fitness Signature is a spider or radar type of chart that represents your interval efforts over a 6 week period which you supply the end date for. There is also a new option on signup to automatically create and save default power zones/interval durations based on your FTP/CP. There is also a fix for the rarely seen "3 vertical lines" Google Maps bug on the ride page.
2019 - 2020
A module to calculate Critical Power was introduced. KPower, heart rate based power estimation was rolled out.

Race Win!
KOM Informatics Lead Developer David Brown took the top step at Bridge Velo's 2019 Eddy TT on July 13th. The race served as New Jersey's State Championship race for non-TT bikes

6 Week Training Summary
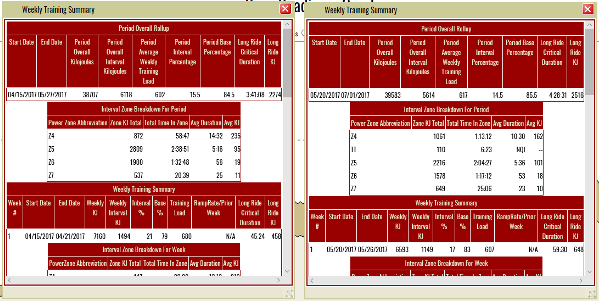
Did you ever have a really good day on the bike? Maybe you got a podium in a race, bagged a Strava KOM or achieved a PR on a route you ride fairly often. And then think to yourself, "Man, if I could only figure exactly what I did to get there life on the bike would be better". In KOMInformatics, the tool to help you figure this out is called the 6 Week Training Summary report. You can click any day on the Race Readiness Graph and get a summary of the training you've done to reach that point. The report summarizes kilojoules (energy expended) for both overall and interval training, our weekly average training load, as well as a summary of both kilojoules and time for each zone of your interval training. The detail section breaks down this information on a week-by-week basis. This provides a detailed prescription of training volume and composition for you to follow next season when you're trying to figure out how to peak.

6 Week Comparison
Did you ever have a few weeks when it felt like your training wasn't on track? Maybe you got dropped in a race or group ride or your power test wasn't quite up to the standard set in prior years. The KOM Informatics tool to help with this situation is called the Six Week Comparison report. From the Race Readiness Graph first you select an Period 1 End Date from a period where things were going well for you - maybe a day with a good race result or power test that went well. Next you select a Period 2 End Date which corresponds to your last 6 weeks of training. Finally you click the Get Period Comparison link to launch the report. The screenshot shows I'm deficient(pink cells) in a number of areas. First, I need to get some more time in riding since I'm down 1:46:47 of moving time currently vs Period 1. (Overall Rollup section) Second, I need to up my interval work in 3 training zones Z4, Z5L, and Z5U where I am down 30:03, 34:09, and 3:21 respectively. Although I'm currently ok (green cells) in 3 interval zones (TT, Z6, Z7) I know I'll have to monitor this report on a daily basis. As new rides are uploaded, old rides drop off and the data changes. (Interval Comparison) I feel if I can get my workload aligned with 2019 I can get back the 8 watts I'm down in the 8-20m category, and the 4 watts I'm down in the 20-60m category (Performance Comparison).
2019
A module to calculate Critical Power was introduced. KPower, heart rate based power estimation was rolled out.
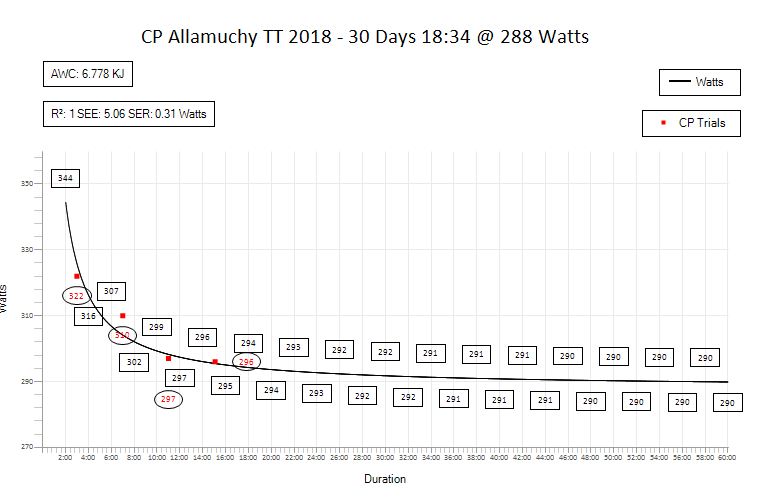
Critical Power
A module to calculate Critical Power was also created in 2019. The main practical use of the theory is to predict wattage of a longer TT based on shorter trials. An article on the history, theory, and some of the practical considerations of Critical Power, along with an overview of how it's been implemented into the system can be found by clicking the link above.
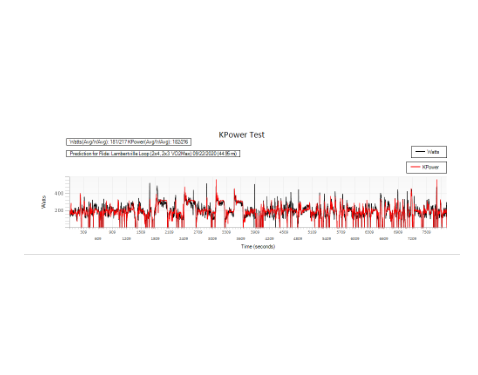
KPower
KOM Informatics has a novel algorithm that predicts power based on heartrate.
It works by using the rides you've uploaded with both power and heartrate data as prediction sources.
You can begin using KPower after you've uploaded at least 20 rides with both power and heartrate data. The more of these type of rides you upload the better the predictions will be.
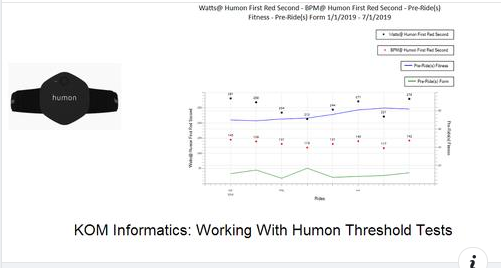
Ride Summary Charts
2019 also saw the advent of Ride Summary Charts an ad hoc chart creation tool. You can select 1 or more of 35 ride summary based metrics and display them on a chart which is implemented as a .png image which can be saved to a local file system. The data reported on can be constrained by date range or through the use of tags which get matched to the Comments column of a ride on a contains basis. Here's an article that shows how this functionality is used report on the outcomes of Humon threshold tests
Late 2018 - Early 2019
Muscle oxygen data (SmO2) was integrated into the system. Ride Summary Charts an ad hoc chart creation tool was developed.
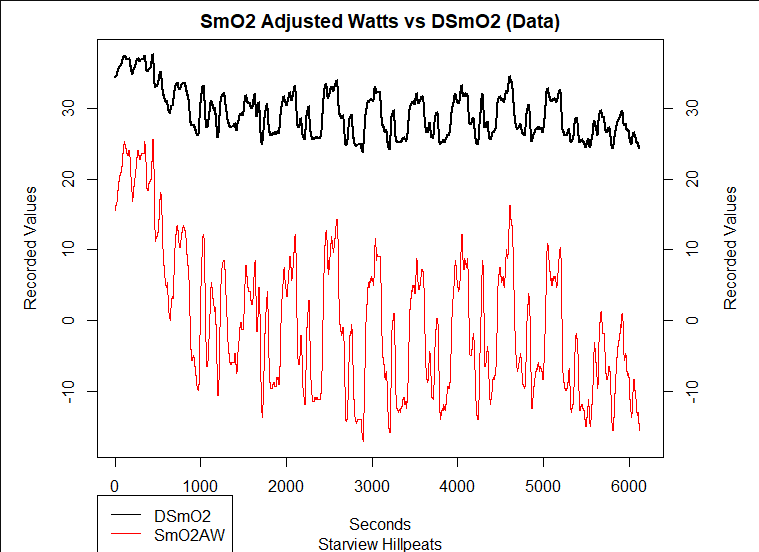
SmO2 Weighted Average Power
In the Fall of 2018 I integrated muscle oxygen data (SmO2) into the system. I had long suspected that cycling analytics applications using traditional power based methods for calculating weighted average power were under-reporting training load for rides involving high intensity efforts. So, I did a study comparing the output of 2 popular smoothing algorithms, simple moving average (SMA) and exponential moving average (EMA) with muscle oxygen data.
Gauging Interval Quality
The Humon Hex muscle oxygen device has a color based system for tagging how hard a cyclist is working based on muscle oxygen data. Viewing the muscle oxygen data alongside interval data can yield valuable insights as to how well the intervals are working.

Race Win!
KOM Informatics Lead Developer David Brown took the top step at Bridge Velo's 2018 Eddy TT on July 28th. The race served as New Jersey's State Championship race for non-TT bikes
2017 - Early 2018
KOM Informatics has been under development since 2017. Take a look at some of the early blog posts if you want to know how the system has evolved
Fall Training
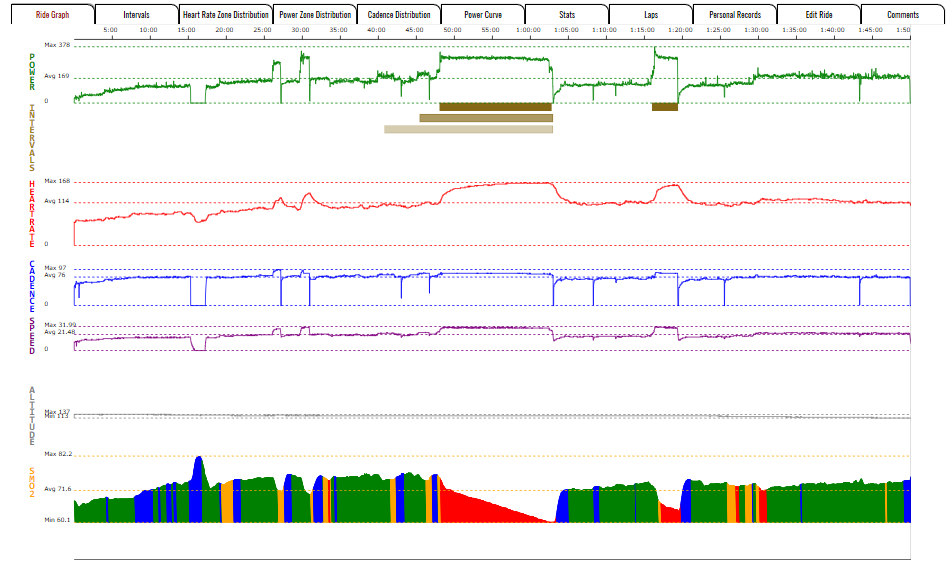
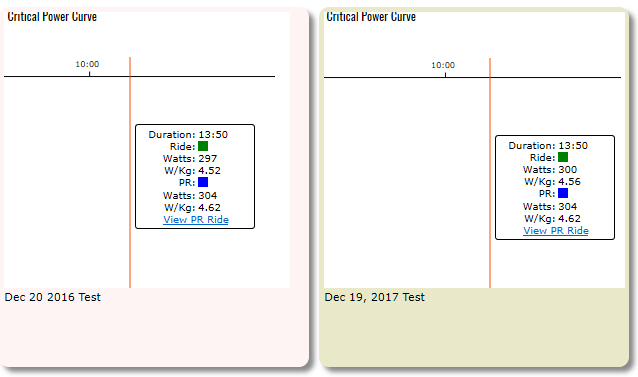
The main question that KOM Informatics attempts to answer is "How is workload affecting performance?". This article, first published in December 2017, discusses the 6 Week Training Summary report, the first tool created to focus on this question, and how I used it to explain a small improvement, year over year in a TT effort.
Workload/Performance
KOM Informatics tracks time and kilojoules for all interval work, as well as non-interval work. At the same time the Personal Records subsystem records best wattage effort for 18 "time boxes" for each ride. These time boxes were selected to correspond to pretty standard interval lengths which are prescribed by cycling coaches. The Personal Records report allows filtering this data by date range, and number returned. The system brings the 2 concepts together by providing statistical correlations between workload and performance. Here is an article which discusses how the system accomplishes this.
Raising 20 Minute Power
There's a slang term in the software development industry "dogfooding" that references a scenario where people in an organization use the organization's product The term definitely applies to me as I've been using my homegrown cycling analytics application KOM Informatics to try to improve my cycling power. This spring marks the first time I've had a chance to digest and use the findings of a whole year's worth of data. Click the link above to find out if it worked!