SmO2 Weighted Average Power
by David Brown
Abstract
Cycling analytics applications use a concept known as weighted average power to help characterize the physiologic cost of a ride. I felt that for a subset of my rides, those that involved interval or race level efforts the reported weighted average power was substantially less then what might have been predicted from the rate of perceived exertion. Since weighted average power is an integral part of training load calculations, I felt the latter calculation along with estimates of recovery time were affected as well.
As part of the process to calculate weighted average power, cycling analytic applications employ smoothing algorithms on recorded wattage data to account for the physiologic cost of a ride. I compared the output of the smoothing step to muscle oxygen (SmO2) data for 2 popular smoothing methods for 52 of my rides using Spearman's Rank Correlation. The correlation was weak, averaging .19 for entire rides, and moderate, averaging .5 for rides disregarding the warmup period.
I constructed a new formula to calculate weighted average power using SmO2 data, and calculated new weighted average powers, along with weighted average powers using traditional formulas. Out of 52 rides 15 rides gained 17 watts or more under the new formula. 1 ride gained 11 watts. 26 rides gained 1 to 4 watts. for 6 rides the weighted average powers were the same. For 4 rides the weighted average power calculated with the new formula was less then that yielded by the traditional calculation. Those rides that gained 17 watts or more were characterized by higher average time spent in training zones 6 and 7 and higher average interval kilojoules then those rides that gained 16 watts or less (Zone 6 + Zone 7 seconds 339 vs 7.72, Interval KJ 101.65 vs 35.46).
Introduction
As competitive cyclists we've all had those tough training days that seem to require more recovery time then the reported training load would indicate. I had a couple of those days towards the end of this year's racing season.
The first (Good Leg Day(Z2, Z3 + Sprints)) was a training ride which incorporated some sprint intervals at the beginning, followed by an endurance section. Overall this ride was 2:53, 60.5 miles at 3.18 w/kg. That represents a season high effort for me at this duration. Strava had this ride at 186 training load. According to guidelines from the Strava website full recovery from this effort should occur within 36-48 hours.
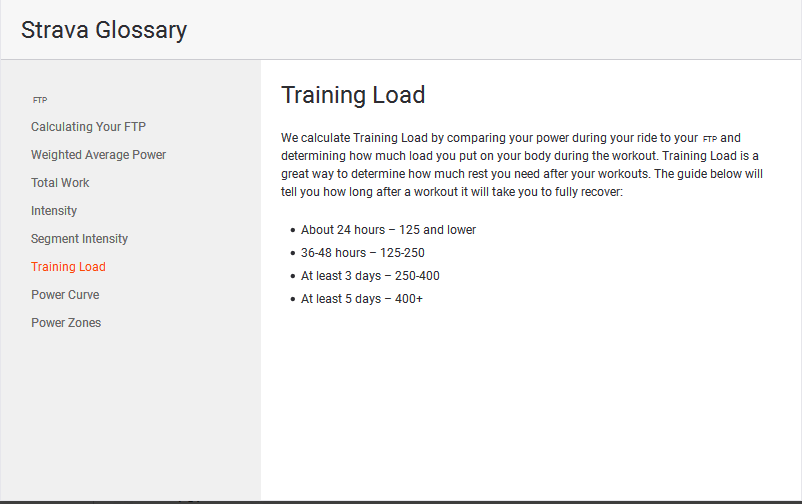
The second (Starview Hillpeats) was a hill repeat interval ride in late September where I was trying to get some fitness back that was lost in the terrible weather we had the first 2 weeks in September. The ride was on a Thursday, and the CRCofA Club Championship race that I was trying to peak for was that Sunday. This ride was 1:42, 24.81 miles at 2.48 w/kg. Strava had this ride at a 109 training load. According to the Strava guidelines full recovery from this effort should occur within 24 hours.
So, how well did the Strava guidelines predict my recovery time? My feeling is that it didn't do an even adequate job. Two days after the "Good Leg Day" ride I did an endurance ride which I complained about afterwards on Strava about having heavy legs. There was no way I was doing any intensity at all that day. Three days after the Starview Hillpeats ride I raced in the CRCofA Club Championship. I got dropped and apologized later to others in my group for not keeping up. (Our races are handicap races, everyone in a group works together until the end). Although I did a light openers ride the day before the race, there is no doubt in my mind that I was still feeling the effects of the ride from 3 days prior.
So, how to explain the seeming discrepancy between my experience and the recovery times outlined on Strava? My hypothesis is that the formulas to compute weighted average power commonly in use in cycling analytics applications are underestimating the physiologic costs, for me, of efforts incurred in higher training zones . Weighted average power is one of the components used to calculate training load in cycling analytics applications.
Weighted Average Power
Weighted average power is an attempt to capture the physiological cost of a ride. It's an estimate of the power one would have had to have maintained if effort were applied evenly throughout the ride. There are two main variants in use today, the Training Peaks variant called Normalized Power(tm) or NP(tm) developed by Dr. Andrew Coggan, and xPower(tm) developed by Dr. Phil Skiba. Normalized Power and NP are trademarks of Peaksware LLC. xPower is a trademark of PhysFarm Training Systems LLC.
The Coggan formula can be found in the book "Training and Racing With a Power Meter". 1 It's also pretty easy to find pages on the web which have the formulas. For the Skiba formula: Analysis of Power Output and Training Stress in Cyclists: The Development of the BikeScoreTM Algorithm 2
There is a good discussion of the origin of these formulas in the Skiba article. Skiba states that the Coggan formula utilizes a "power dependent intensity weighting factor derived directly from a plot of blood lactate concentration as a percentage of concentration at threshold against % of threshold power. His work indicated a near 4th power relationship between the two." The Skiba formula also makes use of this insight.
What this amounts to, for both formulas is raising the wattages for each second to the 4th power, averaging those values, and then taking the 4th root of the averages. Bigger numbers count proportionally more in the 4th power derived average. However neither formula uses the raw wattage output from a ride as an input to this step since raw wattage does not account for the bodies physiologic response to the stress of outputting those watts.
To handle this problem both formulas utilize a smoothing step on raw wattage. The Coggan formula uses a 30 second simple moving average (SMA), while the Skiba forumula uses a 25 second exponentially weighted average (EMA).
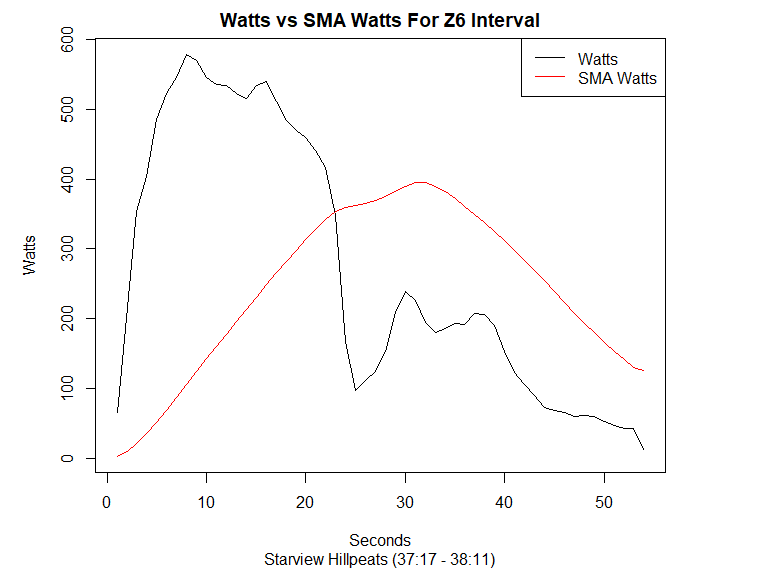
It's not difficult to see how this works. At the start of an interval a
cyclist starts throwing down big watts. However, the smoothing algorithms
don't give full credit for those big watts right away since they are diluted
by the easier efforts incurred prior to the interval. As the interval
progresses, the averages catch up to the second by second output.
Once the averaging window is attained past the start of the interval the
smoothed watts are going to edge closer to the raw watts assuming an
even application of effort. After the interval is finished raw watts
usually drop off precipitously. However the body is still feeling the effects
of the interval; the formulas take this into account by slowly dropping
smoothed watts within the scope of the averaging window. Click on the
thumbnail to see a graph depicting this process:
So, for any given second of a ride past the intial 25 or 30 second window we have both a raw wattage and a smoothed wattage. Somehow, the smoothed wattage is supposed to account for the body's physiologic response to the stress of the ride. I wanted to try to understand how well it does this, and I had the intuition that it might be useful and interesting to compare smoothed wattage to one or more streams of physiological ride data available to me. At this point, a couple of questions arose. The first revolved around the selection of physiological data for comparison. The second involved figuring out the useful ways to quantify the smoothed wattage.
With respect to the first question one approach might be to compare smoothed wattage to heart rate. However, heart rate as a measure of how metabolically taxing a ride is has largely been discounted by exercise physiologists since it can be influenced by factors such as hydration, illness or cardiac drift. 2
A more promising approach, and the one I ultimately decided on was to compare smoothed wattage to muscle oxygen (SmO2) levels.
With respect to the second question I decided to look at smoothed wattages a couple of different ways.
The first involves looking at the difference, for any given second of a ride between the recorded wattage and the smoothed wattage. I'm going to call this watts differential. Recall that at the beginning of an interval a cyclist starts to throw down big watts, but the smoothing algorithm dilutes these big watts with easier efforts incurred prior to the interval's onset. As the interval progresses, the averages catch up to the second by second output. This process seems to be analogous to SmO2 levels dropping (or desaturated SmO2 rising) as an interval progresses. After the interval is over effort drops right away but the smoothed wattage slowly fades within the scope of the averaging window. This process seems to be analogous to SmO2 levels rising (or desaturated SmO2 falling). So, the idea here is to compare the output of the inferred or modeled process embodied in the smoothing algorithms with the SmO2 data stream.
The second way at looking at smoothed wattages is to compare all of the data points to all of the SmO2 data points on a second-by-second basis. Perhaps it is more useful to understand the totality of the smoothed wattage for a ride as a more apt analogy for the body's physiologic response to the stress of the ride.
Muscle Oxygen
I've been recording muscle oxygen for my last 50 rides or so using the Humon Hex muscle oxygen sensor. Here is a description of the technology from the Humon.IO website: "The Humon Hex uses near-infrared spectroscopy [NIRS] to measure the oxygen saturation in muscles (also referred to as SmO2 % or Muscle Ox %). LEDs emit light into the muscle tissue and several detectors measure the light intensity as it propagates through the muscle. Since oxyhemoglobin (HbO2) and deoxyhemoglobin (Hb) have different absorption spectra in the near-infrared wavelength range, the Muscle Ox can be calculated. In other words, the Hex looks at the color of your blood in the muscle in real time and from that determines your Muscle Ox." From using the Hex in conjunction with interval training I can attest that for me at least SmO2 % drops immediately and reliably in response to intervals.
Researchers have investigated the use of NIRS technology to measure lactate levels in whole blood and have found that "NIRS may provide a valuable tool to assess physiological status for both research and clinical use." 3 Another study used NIRS to study the effects of sprint interval cycling training in elite field hockey players. According to the authors, the results of the study "demonstrates the potential of utilizing NIRS as a tool to monitor local muscle oxygen flow and metabolism." 4 This study concluded that "The fact that each individual subject demonstrated similar NIRS signal patterns suggests that these parameters could be useful reporters of training adaptations. Based on the assumption that an increase in the desaturation of muscle oxygen saturation (TSI) and an increment in the HHb+HMb amplitude overall represents an increase in muscle oxygen extraction. These observed changes can be termed as ‘positive peripheral muscle oxygen adaptations’ which have specifically occurred in response to training. This study cited an earlier study which stated " It has also been suggested that the increased level of muscle deoxygenation and near maximal stress to the energy pathways that occur during SIT(sprint interval training) exercise could act as a potential initiator mechanism for mitochondrial biogenesis 5"
To my eye these although these researchers haven't come to any definite conclusions, there is a least some level of support for the idea NIRS technology can effectively be used to monitor oxygen metabolism and that increased levels of muscle deoxygenation can initiate training adaptations. This suggests that SmO2 data gathered through NIRS technology is a pretty good way to measure the the body's physiologic response to the stress of a ride as a precursor to calculating training load.
Test Methods
Both power and muscle oxygen data get wrapped into the .fit file recorded by my Wahoo ELEMNT cycling computer. I have my own cycling analytics software package called KOM Informatics which parses the .fit file and pulls the data into a Microsoft SQL Server database.
I used R statistics software to examine the goodness of fit of both the watts and the SmO2 data to the normal distribution for 10 sample rides. I settled on the Anderson Darling normality test as it can handle both large sets and ties in the data. All of the p-values returned from the test were substantially less then 0.05 so I rejected the null hypothesis that the data from the sample rides were from a normal distribution. Accordingly I used the Spearman Rank correlation, a nonparametric method for the analysis.
I ignored rides which had dropouts in either SmO2 or power data. SmO2 dropouts with 1 exception occurred only in the context of trainer rides where I got off the bike and out of bluetooth broadcast range. I had one endurance ride where the Hex slipped on my leg. Because the SmO2 levels dropped significantly after that point while power levels didn't I excluded this ride.I had one power dropout incident which happened because I ran out of battery. I lost an entire ride due to a catastrophic failure of my Wahoo ELEMNT cycling computer (Wahoo provided a replacement under warranty). After these exclusions I ended up with 52 test rides.
The Humon Hex reports SmO2 as a percentage of oxygen saturation. For the test I chose to look at the oxygen desaturation percentage (100 - SmO2) as this rises in response to effort - any graphs would hopefully show smoothed wattage and deoxygenation percentage plots moving in the same direction. If the smoothed wattage from the formulas and oxygen desaturation percentage correlated perfectly, then the Spearman's correlation should return + 1. Correlations were calculated using SQL Server for both simple moving averages with a 30 second averaging window (SMA) and exponential moving averages with a 25 second averaging window (EMA).
SMA/EMA Results
The results of the tests were as follows:
Watts Differential Rank to Deoxygenated SmO2 Rank
SMA had an average correlation coefficient of 0.0888. The strongest correlation for SMA was 0.324, with the weakest being -0.0449. SMA had a statistically significant correlation at an 95% confidence level (p <.05) for 18 out of 52 rides, about 35%.
EMA had an average correlation coefficient of 0.0681 The strongest correlation for EMA was 0.2746, with the weakest being -0.0517. EMA had a statistically significant correlation at an 95% confidence level (p <.05) for 17 out of 52 rides, about 33%.
Here's a table of the correlations for both SMA and EMA for all 52 rides: Spearman's Correlation: Watts Differential Rank to Deoxygenated SmO2 Rank (p <.05)
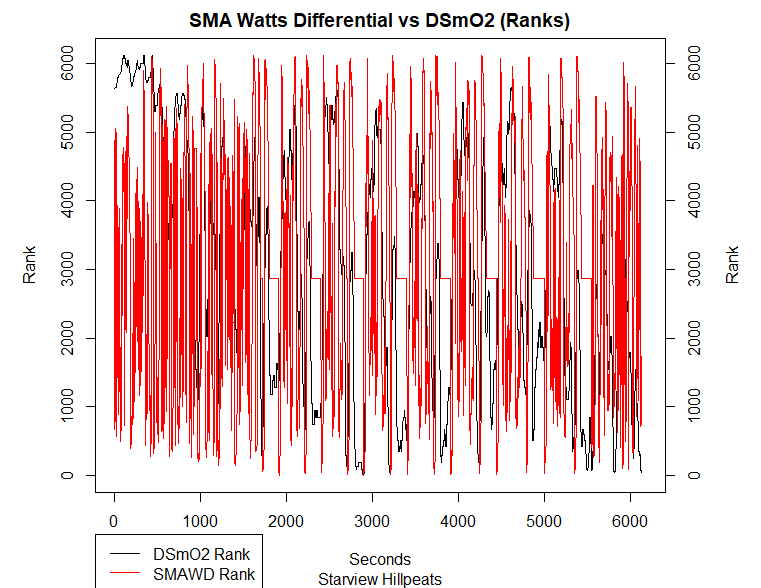
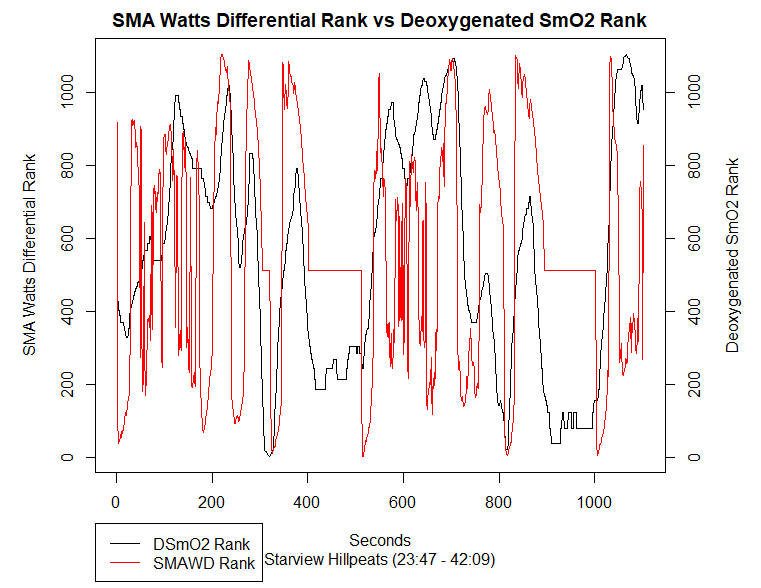
Here are a couple of plots of SMA Watts Differential vs Deoxgenated SmO2 for
one of the rides, Starview Hillpeats. The first plot is for the entire ride,
the second is for about a 20 minute slice. The mismatches are easier to
see on the second plot. Click on a thumbnail to see the larger image.
Smoothed Wattage Rank to Deoxygenated SmO2 Rank (Entire Rides)
SMA had an average correlation coefficient of 0.21. The strongest correlation for SMA was 0.83, with the weakest being -0.76. SMA had a statistically significant correlation at an 95% confidence level (p <.05) for 48 out of 52 rides, about 92%.
EMA had an average correlation coefficient of 0.17 The strongest correlation for EMA was 0.81, with the weakest being -0.77. EMA had a statistically significant correlation at an 95% confidence level (p <.05) for 49 out of 52 rides, about 94%.
SMA/EMA did better on this test then on the previous one. SMA had a moderately strong to strong correlation ( > .500) on 13 of 52 rides, for EMA 11 of 52 rides fell into this category.
Here's a table of the correlations for both SMA and EMA for all 52 rides: Spearman's Correlation: Smoothed Watts Rank to Deoxygenated SmO2 Rank (p <.05)
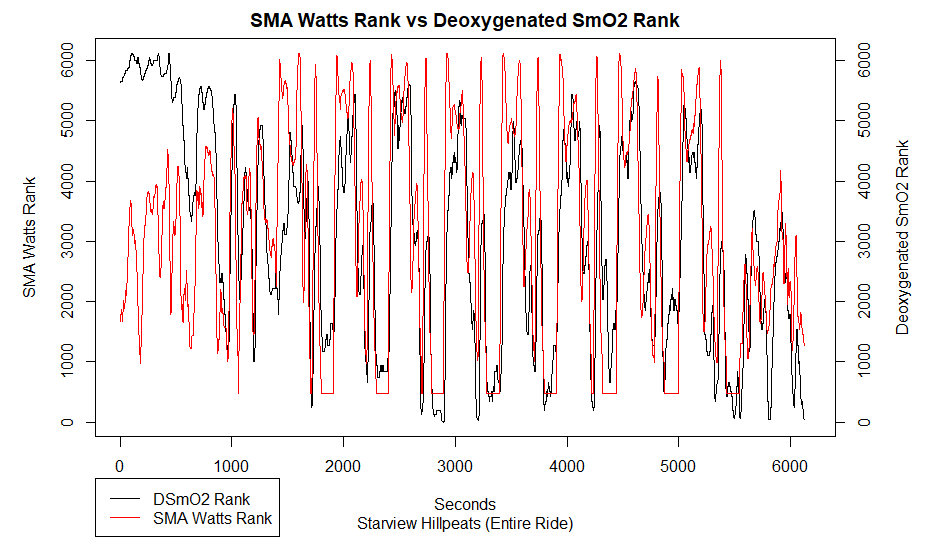
Here is a plot of smoothed SMA Watts rank vs Deoxgenated SmO2 rank for
one of the rides, Starview Hillpeats. This one
has a moderately strong correlation (.630)
Smoothed Wattage Rank to Deoxygenated SmO2 Rank (After Warmup Period)
I decided to also look at entire rides disregarding the warmup period. I'm defining the warmup period as the time that it takes to first reach average SmO2. For all of my rides the warmup period was characterized by relatively low SmO2(high deoxygenated SmO2), and relatively low wattage. Including the warmup period can be seen as unfairly skewing the correlations lower then they might be had it not been included.
In this context, SMA had an average correlation coefficient of 0.50. The strongest correlation for SMA was 0.87, with the weakest being -0.43. SMA had a statistically significant correlation at an 95% confidence level (p <.05) for 50 out of 52 rides, about 96%.
EMA had an average correlation coefficient of 0.45 The strongest correlation for EMA was 0.86, with the weakest being -0.49. EMA had a statistically significant correlation at an 95% confidence level (p <.05) for 49 out of 52 rides, about 94%.
SMA/EMA did better on this test then on the previous one. SMA had a moderately strong to strong correlation ( > .500) on 30 of 52 rides, for EMA 27 of 52 rides fell into this category.
Here's a table of the correlations for both SMA and EMA for all warmup shortened 52 rides: Spearman's Correlation: Smoothed Watts Rank to Deoxygenated SmO2 Rank After Warmup Period (p <.05)
The generally weak to moderate correlations between smoothed wattages calculated with EMA/SMA on the one hand and SmO2 on the other suggested to me that a formula which takes SmO2 into account could provide a more accurate weighted average power, and thus training load. So, I set out to create one.
Creating SmO2 Weighted Average Power
I kept a single principle I wanted to adhere in mind in creating the new formula: It should derive a number which functions the same way as watts differential does for SMA and EMA, applying both positive and negative watts in a way proportional to SmO2 levels. I'm going to call this number SmO2 Adjusted Watts. This approach yields a couple of benefits:
1. The results of the new formula could be compared to the SmO2 data again using a Spearman's rank correlation. A tighter correlation compared to the ones found with SMA/EMA could be seen as evidence that the new approach was an improvement.
2. The weighted average power calculated by the new formula could be seamlessly plugged into existing code that calculates training load.
The new formula which I'm calling SmO2 Weighted Average Power uses an empirical approach via SQL queries, to determine what a change in SmO2 level is worth in terms of watts for a given ride. For each second of a ride, it then adds a product of that number and a factor to the recorded watts. The factor is based on how far away the recorded SmO2 is from average SmO2, and whether the recorded SmO2 is more or less then the average. The SmO2 adjusted watts are then raised to the 4th power, averaging those values, and then taking the 4th root of the averages. This last step is the same as in the Coggan and Skiba formulas.
Here are the conceptual steps to implement the formula:
1. Decide on an averaging period and exponential boost.
2. Calculate a SMA for watts based on the averaging period in step 1
3. Calculate the earliest point in the ride where the average SmO2 is attained
4. Calculate average SMA watts per SMo2 Level
5. Calculate difference in SMA watts for contiguous SMo2 levels (AvgSMAWattsPerSMo2LevelDiff)
6. Calculate the average AvgSMAWattsPerSMo2LevelDiff for the entire ride
7. Calculate the average SMo2 for the ride
8. Calculate the SMo2WattsDifferential & SMo2AdjustedWatts for the ride
9. Weight the higher watts using the exponential boost from step 1 and derive the SMo2 Adjusted Weighted Average Power
A link to the steps with further explanation and examples along with a link to a working T-SQL script can be found here
SmO2 Weighted Average Power Results
I calculated SmO2 Weighted Average Power (SmO2WAP) and weighted average power calculated with SMA/EMA for the 52 rides along with the difference between the weighted average powers (WAPD) for each method. Just to be clear, the weighted average powers calculated with SMA/EMA are NOT the same as NP (tm) or xPower (tm). the There are 2 sets of results one for SMA and one for EMA. SmO2WAP uses SMA in the first case and EMA in the second case for it's averaging method. The results also include correlations for SmO2 Adjusted Watts rank to Deoxygenated SmO2 rank.
For just the rides where lower Smo2 levels were associated with higher watts (mostly harder rides where the SMA/EMA Watts Per SMo2 Level Difference < 0): The SmO2 Adjusted Watts rank had a perfect correlation to Deoxygenated SmO2 rank (SMA 1.00, EMA 1.00). The strongest correlation was (SMA 1.00 EMA 1.00), with the weakest being (SMA 1.00 EMA 1.00). The correlation was statistically significant at an 95% confidence level (p <.05) for (SMA 47 out of 47 rides, EMA 46 out of 46)
For this set of rides the SmO2WAP algorithm provides a positive watts adjustment to those seconds where the SmO2 level is below average, and a negative watts adjustment to those seconds where the SmO2 level is above average
For just the rides where higher Smo2 levels were associated with higher watts (mostly easier rides where the SMA/EMA Watts Per SMo2 Level Difference > 0): The SmO2 Adjusted Watts rank had a perfect average negative correlation to Deoxygenated SmO2 rank (SMA -1, EMA -1). The strongest correlation was (SMA -1 EMA -1), with the weakest being (SMA -1 EMA -1) The correlation was statistically significant at an 95% confidence level (p <.05) for (SMA 5 out of 5 rides, EMA 6 out of 6)
For this set of rides the algorithm provides no watts adjustment at all for those seconds where the SmO2 level is equal to the minimum SmO2 level. For all other rows it provides a negative watts adjustment based upon how far the recorded SmO2 is from the minimum SmO2. The farther away, the greater the adjustment.
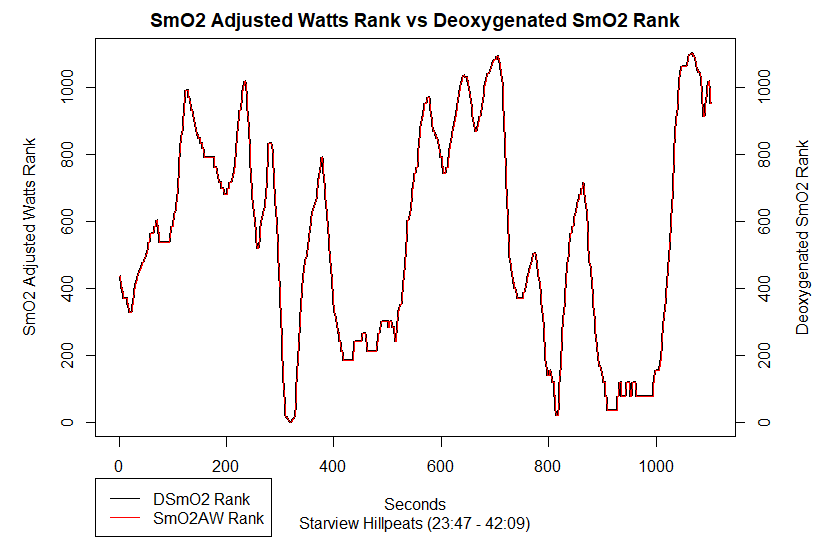
|
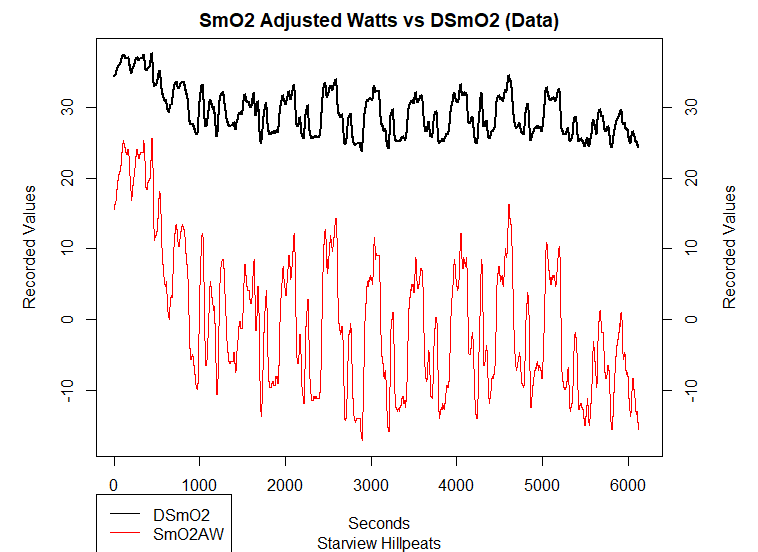
|
| The SmO2 Adjusted Watts rank has a perfect correlation to Deoxygenated SmO2 rank on this partial view of the Starview Hillpeats ride. I had to make the black line (Deoxygenated SmO2 Watts Differential) thicker then the red (Deoxygenated SmO2) to show that both were plotted. If I hadn't, only the red would have shown since the correlation is perfect. | Here's a plot of the SmO2 Adjusted Watts and Deoxygenated SmO2 from the Starview Hillpeats ride. This is not the ranks, it's the actual data. Although the former ranges over a wider group of numbers and includes both positives and negatives when compared to the latter, it's pretty easy to see they are closely related. |
The 2 rides which I mentioned at the beginning of this article Good Leg Day(Z2, Z3 + Sprints) and Starview Hillpeats gained the most weighted average watts with SmO2WAP as compared to the SMA/EMA calculations
| SMA | |||||||
| Ride Title | Weighted Average Power SMA/EMA | SMo2 Weighted Average Power | WAP Difference | WAP % Difference | Training Load (Strava) | Training Load (SMo2) | Training Load % Difference |
| Good Leg Day(Z2, Z3 + Sprints) | 234 | 265 | 31 | 13 | 186 | 257 | 40 |
| Starview Hillpeats | 249 | 279 | 30 | 12 | 109 | 167 | 53 |
| EMA | |||||||
| Good Leg Day(Z2, Z3 + Sprints) | 233 | 265 | 32 | 14 | 186 | 257 | 40 |
| Starview Hillpeats | 245 | 279 | 34 | 14 | 109 | 167 | 53 |
There is a strong correlation between WAPD and time spent in Zone 6 and Zone 7 training zones (SMA .8717, EMA .8759). I'm using Zone 6 to refer to anaerobic capacity and Zone 7 to refer to neuromuscular following table 3.4 in "Training & Racing With A Power Meter" 1
There is a moderately strong correlation between WAPD and Interval KJ (SMA 0.6283, EMA 0.6186) For this test I included intervals at or above FTP. (My homegrown cycling analytics application, called KOM Informatics detects and distills intervals. Click the link for a look at Starview Hillpeats ride page that I extracted from the application for a look at this.)
On the SMA side 15 rides gained 17 watts or more under the new formula (Big Gainers group). 1 ride gained 11 watts. 26 rides gained 1 to 4 watts. for 6 rides the weighted average powers were the same. For 4 rides the weighted average power calculated with the new formula was less then that yielded by the traditional calculation. Those rides that gained 17 watts or more were characterized by higher average time spent in training zones 6 and 7 and higher average interval kilojoules then those rides that gained 16 watts or less (Zone 6 + Zone 7 seconds 339 vs 7.72, Interval KJ 101.65 vs 35.46).
On the EMA side 15 rides gained 18 watts or more under the new formula (Big Gainers group). 1 ride gained 9 watts. 25 rides gained 1 to 4 watts. for 7 rides the weighted average powers were the same. For 4 rides the weighted average power calculated with the new formula was less then that yielded by the traditional calculation. Those rides that gained 18 watts or more were characterized by higher average time spent in training zones 6 and 7 and higher average interval kilojoules then those rides that gained 17 watts or less (Zone 6 + Zone 7 seconds 339 vs 7.72, Interval KJ 101.65 vs 35.46).
Discussion
The rides from the Big Gainers group had roughly 44 times the amount of Zone 6 + Zone 7 seconds and 3 times the interval kiloujoules compared to the rides not in the group. The Big Gainers group also contains all of the rides that were hard enough so that I publicly complained about them inhibiting attempts at interval or race efforts 2 or 3 days after on Strava. This is the type of ride I had in mind when I formulated my hypothesis that the formulas to compute weighted average power commonly in use in cycling analytics applications are underestimating the physiologic costs, for me, of efforts incurred in higher training zones. If SmO2 Weighted Average Power represents a better way of understanding the physiologic cost of a ride then a corollary of the fact that the Big Gainer rides gained weighted average power under the new formula is that the physiologic cost of these rides were underestimated by the old formulas. To just that extent we might say that the data supports the hypothesis.
So, does SmO2 Weighted Average Power represent a better way of understanding the physiologic cost of a ride? It has a couple of advantages:
1. It uses real SmO2 data as opposed to inferred or modeled data to account for the physiologic cost of a ride
2. The adjusted watts derived from the SmO2 data correlate perfectly with the data itself.
What about drawbacks?
1. The formula hasn't been refined. I'm a software developer, not an exercise physiologist, and I view this release of the formula as a beta version. I'm sure it will be refined in response to feedback and once I learn more. I think the most likely area for refinement is the calculation of the warmup period and how to adjust the watts during this period. However, I tweaked the formula to not apply any watts adjustment to the warmup period for 5 sample rides and the SmO2 Weighted Average Power for all of them changed less then 1 watt.
2. This article is an N=1 study. It might be nice to learn how the formula works for other people! :)
3. It may end up that there are confounding factors involved with SmO2 data, similar to the way hydration, illness or cardiac drift affect the use of heartrate data.
From a riders perspective and user of my own cycling analytics system, weighted average power and the closely related concept of training load are important because they provide an objective measure of how hard I'm working. Having this information enables me to gradually build training load, avoiding overtraining. But if the reported training load doesn't adequately represent what's going on in the body, it can make it difficult to make optimal training decisions. There have been many times where I've been unsure about my ability to complete interval sessions especially if there had been another interval session 2 days prior. The only way to know for sure in these situations is warm up well and just start hammering. My legs have to let me know if it's a no-go.
The SmO2 Weighted Average Power formula has shown the ability to pick out those rides which felt more difficult to me and took a longer then expected time to recover from. Having advance warning of this should enable me to back off when I need to, avoiding overreaching close to a race. For this reason alone developing the new formula has been a worthwhile exercise. I'll be pulling it into my own application in the near future.
This work is Copyright (c) 2019 Impact Informatics. All rights reserved. I have no problem with anyone using the ideas in this paper for any purpose either academic or commercial provided that doing so does not limit me or my company, or any other individuals or companies from using them. I would like to freely share these ideas for the benefit of the cycling community. Please drop me an email at daveb@impactinformatics.com if you come up with anything new while attempting to implement these ideas in your own systems.
References
1. Hunter Allen and Andrew Coggan. Training And Racing With A Power Meter 2nd Edition
2. Phil Skiba, Analysis of Power Output and Training Stress in Cyclists: The Development of the BikeScoreTM Algorithm
3. Lafrance, Denis & Lands, Larry & Hornby, Laura & Rohlicek, Charles & Burns, D.H.. (2000). Lactate measurement in whole blood using near infrared spectroscopy. Canadian Journal of Analytical Sciences and Spectroscopy. 45. 36-40. link
4. Ben Jones, David K. Hamilton, Chris E. Cooper Muscle Oxygen Changes following Sprint Interval Cycling Training in Elite Field Hockey Players. PLOSOne link
5. Buchheit M, Abbiss CR, Peiffer JJ, Laursen PB. Performance and physiological responses during a sprint interval training session: relationships with muscle oxygenation and pulmonary oxygen uptake kinetics. Eur J Appl Physiol. 2012;112(2):767–79. pmid:21667291