KOM Informatics: Raising 20 Minute Power
There's a slang term in the software development industry "dogfooding" that references a scenario where people in an organization use the organization's product.
The term definitely applies to me as I've been using my homegrown cycling analytics application KOM Informatics to try to improve my cycling power. This spring marks the first time I've had a chance to digest and use the findings of a whole year's worth of data.
The application has the ability to detect and distill the most important and relevant intervals accomplished during training. Once detected and recorded the system can aggregate totals by training zone over various time periods. Once the interval totals are known the system can derive both the hours and kilojoules devoted to non-interval training. The result provides a very precise picture of a cyclist's training at any point in time for periods for which data has been provided.
So, what difference does it make having all this information? Would it allow me to push my performance over my best efforts from last year?
2017 Training
In 2017, for the first 4 months I pushed hard on Zone 5 (VO2Max) intervals mostly on the trainer. By the time May rolled around it was becoming increasingly clear that all of the Zone 5 work wasn't making me any better. The racing season had begun. With the onset of nicer weather the focus of the year changed to less structured and longer efforts. The road races also involve a fair amount of Zone 6 (Anaerobic) and Zone 7 (Neuromuscular) work.
These changes seemed to have a beneficial effect on 20 minute power. I hit my 2017 season high of 303 watts on an evening trainer ride on June 1st 2017. At the time the only tool I had in the system was the 6 week training summary. When I compared the 6 weeks of training prior to the Kingwood TT (298 watts), my second highest 20 minute wattage for the season, to the 6 weeks prior to my highest watts trainer session I could see that the latter period involved lots more Zone 7 (Neuromuscular) and more non-interval work, with an increase in overall kilojoules. Here's a screenshot of the Summary Reports side-by-side. The 6 weeks prior to Kingwood summary is on the left, the 6 weeks prior to the trainer side is on the right. Click on the image to see it full size.
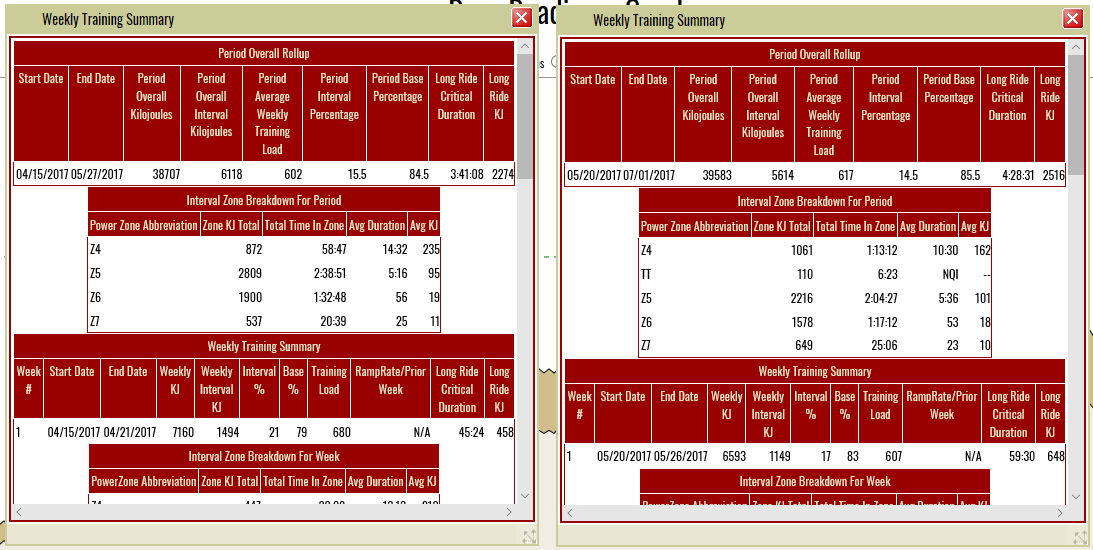
Although I felt like at least part of the uptick in performance could be explained by the time of day discrepancies, I thought there was enough evidence to continue to push on Zone 7 and non-interval work. For more info on morning vs evening efforts check out this article.
2018 Winter Training
These experiences informed my decisions on how to structure winter of 2018 training. I added Tabata intervals to the mix which are 30 second on 30 second off all out Zone 7 efforts. For a good discussion of Tabatas, and other forms of high intensity interval training in general see Effects of High-Intensity Intermittent Training on Endurance Performance
I still did some Zone 5 work in the form of virtual climbs on Zwift, although this years Zone 5 work is only 62% of last year's YTD. The other lesson learned, incorporating longer rides/more kilojoules was very difficult to implement this offseason. I did do some 3 hour trainer rides but couldn't manage them more then once a week as they suck pretty hard!
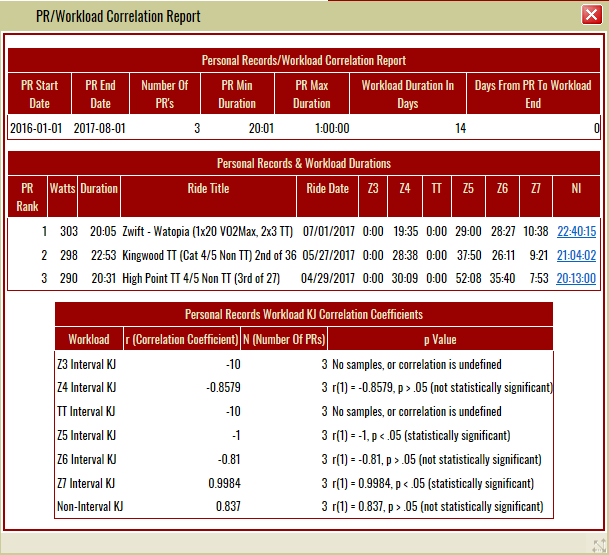
This spring I developed the Personal Records/Workload Correlation Report (below) which corroborated the results I saw in the 6 week training summary. The Z7 correlation is .9984 which is statistically significant. The Non-Interval correlation comes in at .837 which, although not statistically significant, is still high.
As the weather finally started to turn late this Spring, I've managed to get in some longer rides in at least getting a start on that lesson.
2018 Results
So, you might ask, how tasty is that dogfood?
20 minute power Results from the 2018 program have been pretty strong. At the Rt 29 TT on 6/16/2018 I recorded my second best 20 minute power ever, 302 watts for 21:11. This is a 4 watt increase over my third best overall performance which took place at the Kingwood TT on the same course almost a year ago. While that's still 1 watt less then my best, it's probably not a fair comparison since it was a morning effort, as opposed to the overall best which took place in the evening. There is research that shows that morning efforts can involve as much as an 11% reduction in power compared to evening efforts. I'm also 2.5 lbs lighter this year. This year's 302 watt performance is a little higher then last year's 303 in terms of w/kg (4.64 vs 4.61).
| Best Of 2017 vs 2018 20 Minute Power | ||||||
|---|---|---|---|---|---|---|
| Name | Date | Time | Watts | Duration | Watts/Kg | 6 Week Avg Training Load |
| Kingwood TT | 5/27/2017 | AM | 298 | 22:53 | 4.53 | 602 |
| Trainer Ride | 7/1/2017 | PM | 303 | 20:05 | 4.61 | 617 |
| Rt 29 TT | 6/16/2018 | AM | 302 | 21:11 | 4.64 | 546 |
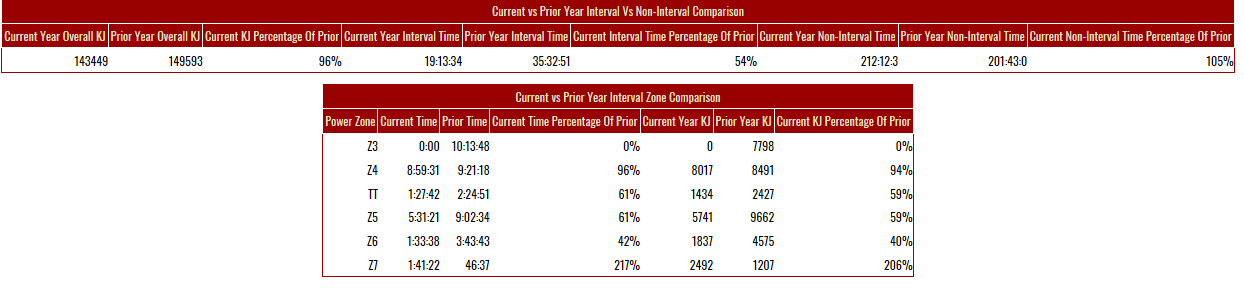
Another reason I like these results is that they were achieved at about 90% of my max 6 week average training load from last year, and YTD total kilojoule expenditure is 96% of last year. So, there's some room to work harder extending the same plan I've been on without getting over trained. Hopefully I can improve a little more before the end of the season. Better results for less work is a good thing! Here's a screenshot of the Rider Stats Year Over Year Report, which shows less KJ, more Zone 7, and less Zone 5 work in 2018 compared to 2017. Click on the image to see it full size.
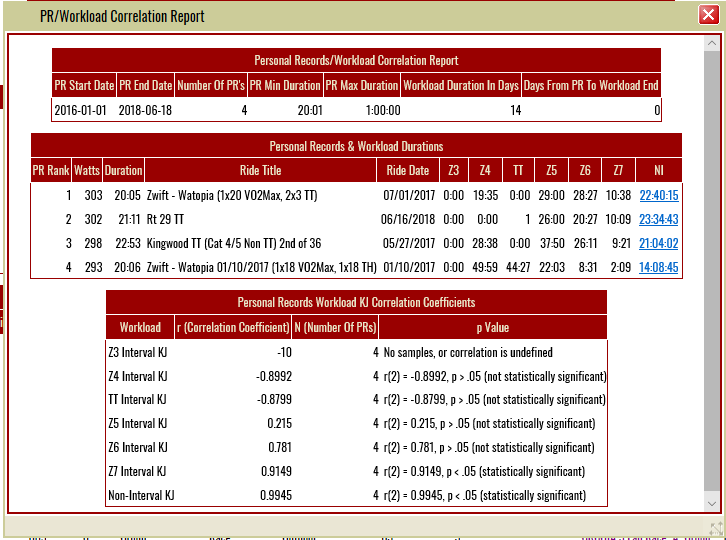
After the RT 29 TT the Personal Records/Workload Correlation Report (below) is showing statistically significant correlations between Z7, and Non-Interval workload and PR Performance which continues the trend noted earlier. This mix of training is still improving things. To improve things further yet I'll up the duration of long rides, and ramp up the number of intervals for those types of rides.
Take-Aways
The take-aways?
As a user of the KOM Informatics system, I'm pleased with the results, and as a developer I can definitively state that the dogfood tastes good. Being able to quantify and understand the training behind my best result in 2017 suggested changes in my training plan that led to an improvement in performance on the same course in 2018 all at a reduced energy cost. Can your cycling analytics software do that?
References
"Effect of Time of Day on Performance, Hormonal and Metabolic Response during a 1000-M Cycling Time Trial" Alan Lins Fernandes, João Paulo Lopes-Silva, Rômulo Bertuzzi, Dulce Elena Casarini, Danielle Yuri Arita, David John Bishop, Adriano Eduardo Lima-Silva, October 7, 2014 PLOS One https://doi.org/10.1371/journal.pone.0109954
"Effects of High-Intensity Intermittent Training on Endurance Performance" Christian Finn Sportscience 5(1), sportsci.org/jour/0101/cf.html, 2001