KOM Informatics: Statistical Correlations Between Workload And Performance
Although accurately recording intervals is one of the main goals of th KOM Informatics system, there are 2 others which are equally, if not more important. The first is that the system should tell users if and when they're getting stronger. The second is to help them understand why. There needs to be a way to relate training workloads, whether interval or non-interval to performance.
Performance In KOM Informatics: Personal Records For Power
KOM Informatics has a Personal Records subsystem which records your best wattage effort for 18 "time boxes" for each ride. These time boxes were selected to correspond to pretty standard interval lengths which are prescribed by cycling coaches.
The Personal Records report allows you to filter this data by date range, and number returned. This allows you to see progress during the offseason where it's unlikely that you'll be hitting all time PR's.
Pearson Correlation Coefficient And Linear Relationships
So, now we've got data both on the training workload (Kilojoules for both interval and non-interval efforts) and the performance (Personal Records) sides. The problem then becomes how to relate the two to provide potentially meaningful insights.
So, I did a little googling on "statistics showing a correlation between 2 factors", and found a bunch of results on the Pearson product moment correlation coefficient (PPMCC). According to a bunch of sites this analysis provides information on the strength and direction of the linear relationship between 2 variables.
A linear relationship is most easily understood in terms of a an example. Imagine for a moment that you live in a perfect world where the amount of energy you put in on a bike is perfectly reflected in your performance. So, you ride during the weeks, and do a time trial up your favorite 1.5 mile 5% grade hill on Sundays, recording the following results.
"Perfect World" TT Test Results
| Week # | Weekly Energy Expenditure (KJ) | Avg Watts For TT |
| 1 | 100 KJ | 100 W |
| 2 | 200 KJ | 200 W |
| 3 | 300 KJ | 300 W |
| 4 | 400 KJ | 400 W |
| 5 | 500 KJ | 500 W |
"Perfect World" TT Test Graph
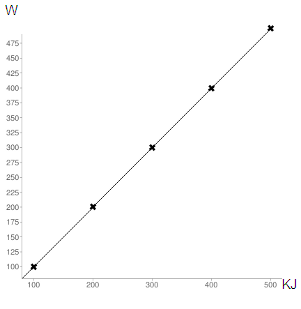
Looking at a graph of these activities notice how the line drawn between the intersect point slopes upwards at an even rate. You are climbing like a pro with only five weeks of training! Life is good. The PPMCC for these values would be 1, which indicates a perfectly uphill positive relationship between the KJ's you put out during the week and your hill climb TT average watts.
The PPMCC values range from 1 (perfectly positive correlation) to -1 (perfectly negative correlation). In general it is a measure as to how closely your data points fits to a straight line when drawn on a graph. When you see a statistically significant correlation (a correlation which exceeds a critical threshold based on the size of the sample), then you get to have an argument with yourself as to whether or not the correlation in question implies anything about the efficacy of your training. Although correlation does not imply causation, you may convince yourself that in certain instances it does after careful examination of both the training and performances embodied in the samples.
So, now we've got data both on the training workload and performances, and an interesting way to tie the 2 together which allows multiple samples and provides a way to judge the strength of the relationship between the 2. Here are the steps to take to tie them together in KOM Informatics.
Step By Step Overview Of How It Works In KOM Informatics
- Navigate to the Personal Records page.
- Provide a date range for the PR's along with the number of PR's you want focus on.
- Click the [Go] button to run the Personal Records report.
- After the Personal Records report displays, select the time bucket you're interested in. Scroll to that section of the PR Report and decide if there are any PR's you want to exclude from the Correlation analysis.
- Scroll back up to the top of the page to the Personal Records/Workload Correlation Filters section and fill in how many PR's you want to include in the Correlation analysis.
- Click the radio button that corresponds to the time bucket that holds the PR's you're interested in.
- Then, fill in number of days duration, and how many days removed from the workload window you're interested in.
- Click [Go] to run the Personal Records/Workload Correlation report
A Real Life Example
Here's an example of how the system handles a real life situation. I started adding modified Tabata intervals to my Sunday training in mid December. A Tabata is an all-out effort from 20-30 seconds, with a very short rest period. After doing them I started noticing some gains in other areas of my training, and I wanted to see if the new tools in the application would help me to understand what was going on.
First I brought up the Personal Records page (step 1), and filled in 5 for number of PR's, 12/15/2017 for the Start Date and 2/28/2018 for the End Date (step 2). Since I had noticed short term gains, I limited the date range to the time period where the gains occurred. If you wanted to discover correlations of your all time PR's you would widen the date range to include all of the rides you uploaded to the system. The number of PR's is a somewhat arbitrary decision. However, generally the more samples you include in a correlation analysis, the easier it is to achieve statistical significance. Clicking the [Go] button brought back the report.
Personal Records Report Filters
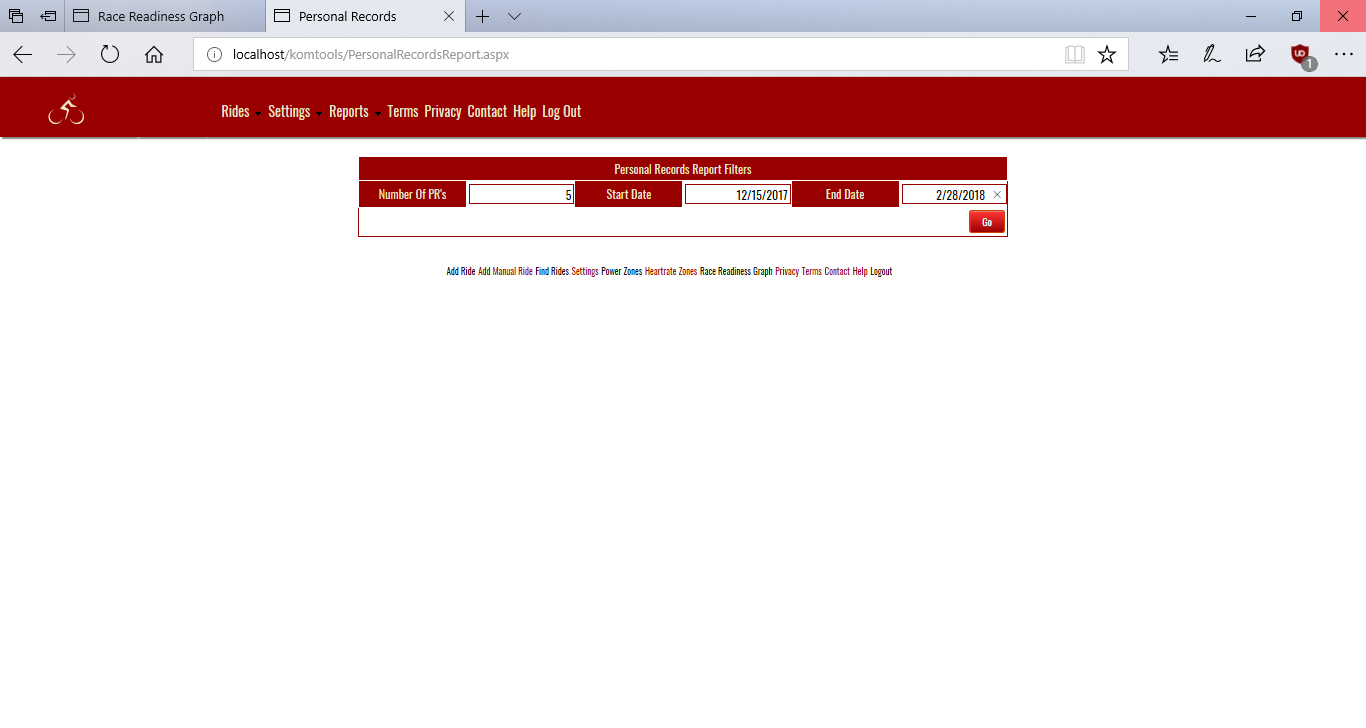
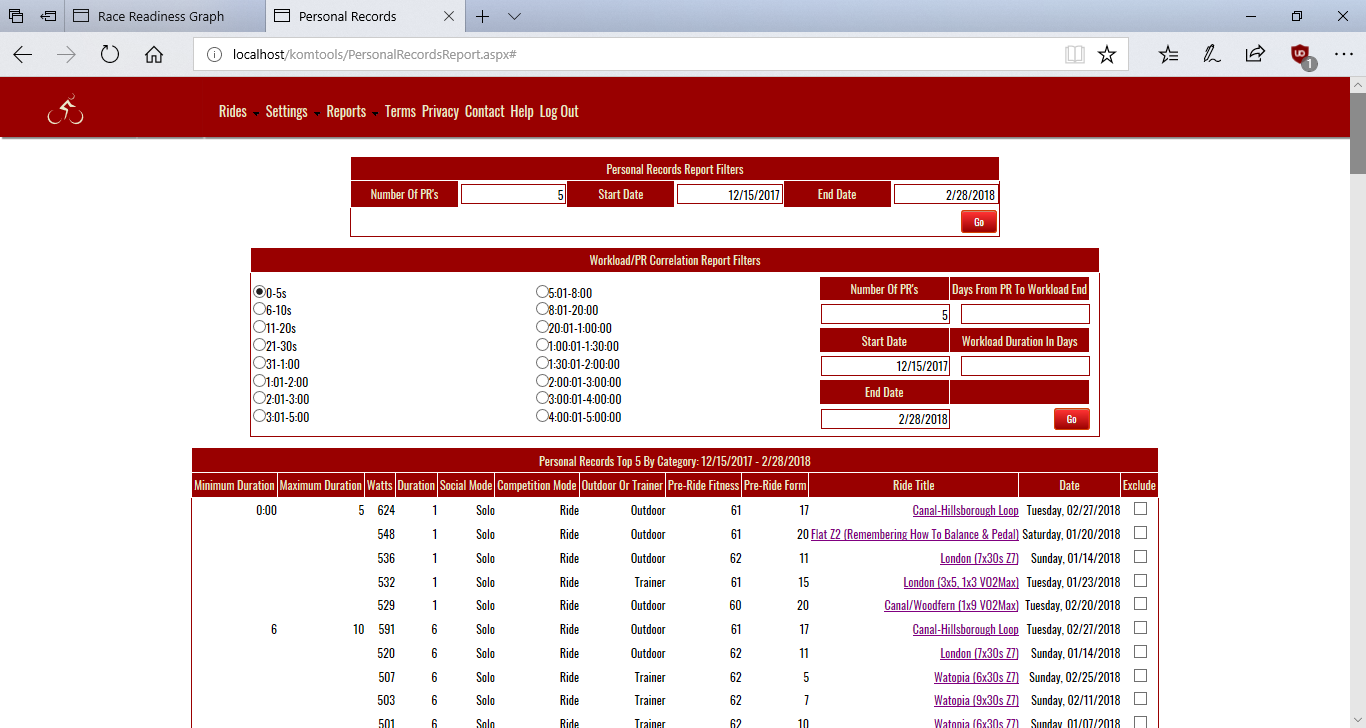
Personal Records Page
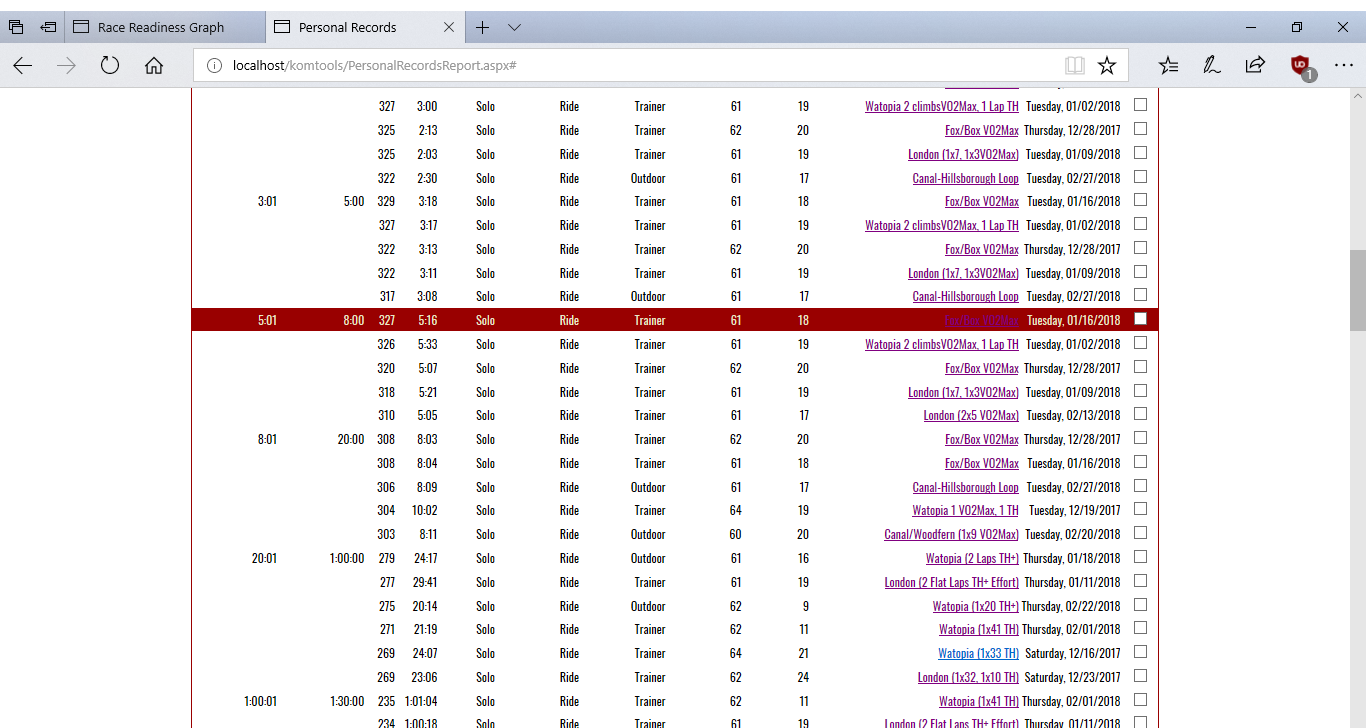
Next, I scrolled down to the 5:01 -8 minute category, the time bucket where I was noticing some of the gains. Then, I drilled down into the rides to take a look at the efforts involved (step 4). I don't believe that a random selection of efforts is the right approach in evaluating performance, anymore then a random selection of "around town" driving miles would give you a good idea of what your car's best 1/4 mile performance is. On the contrary, I believe that only efforts where I was trying my hardest should qualify. Even those efforts might still be rejected if I was feeling "off" that day, or conditions on that day were not sufficiently similar to others in the sample. An example of the latter situation might be evaluating standing + seated efforts against only seated efforts. I know that typically I can perform 50+ watts better in a hill climb using the former approach as opposed to the latter. This philosophy is embodied in KOM Informatics, the application has a checkbox to exclude an effort from a correlation analysis.
In this case I decided to reject the last 2 efforts. The last effort was not an "all out" one, I was holding back some because it was the first in a series of intervals to be done on that day. I rejected the second to last effort because I didn't feel fully recovered on that day. To provide a little more context, this was on a Tuesday, 2 days after Tabata day. About a third of the times I followed the pattern of Tabatas on Sunday with VO2Max efforts on Tuesday I experienced this problem.
5:01-8:00 PR's
Correlation Report Filters

With these selections in mind I scrolled back up to the top of the page to fill in parameters for the Personal Records/Workload Correlation report. I clicked the 5:01 - 8:00 radio button (step 5), and changed the Number Of PR's textbox to 3, limiting the report to the top 3 efforts in the category, rejecting the last 2 efforts.
Next came the workload parameters (step 6). The report enables analyses of any workload "windows" (block of training days) which are defined by the days from the PR to the workload end (looking back in time), and the duration of the workload in days. If you wanted to look at the workloads which occurred on the day prior to each PR, you would fill in 0 for the "Days To PR From Workload End" textbox and 1 for the "Workload Duration In Days" textbox. In this case I used 0 and 7 mostly because I suspected that the benefits from the Tabatas accrue very rapidly. Another reason for the small window immediately preceding the effort was the fact that the efforts involved were only 1 and 2 weeks apart. A larger window would involve a lot of the same workloads being shared among the efforts which I suspected would obscure any trends. In general though, the most recent workouts have the greatest impact on performance. The further back you go, the less impact they have. Clicking [Go] generated the report, which pops up in a floating dialog box and has 3 panels.
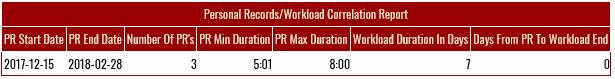
The first panel contains summary information on the PR Date range, the Time Bucket,and the Workload Window. Since you can run more then 1 Personal Records/Workload Correlation from the page, this info allows you to distinguish them.
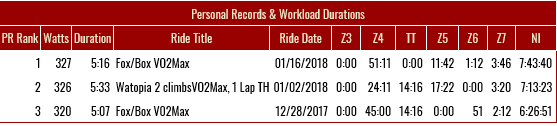
The second contains a recap of the PR's, with a summary of the time spent in each interval range, along with non-interval time for the associated workload window. The time spent columns provide a starting point for deciding whether the associated workload was meaningful in the context of the workload window. Sometimes the report will show a statistically significant correlation between a zone workload and personal records; but if the workload is small, that might lead one to believe that it had no causal effect on the PR's.
The third panel contains the correlation coefficient for the kilojoules of each workload to the PR's listed in the second panel, along with whether the result is statistically significant at a 95% confidence level (p <= .05).
Personal Records/Workload Correlation Report
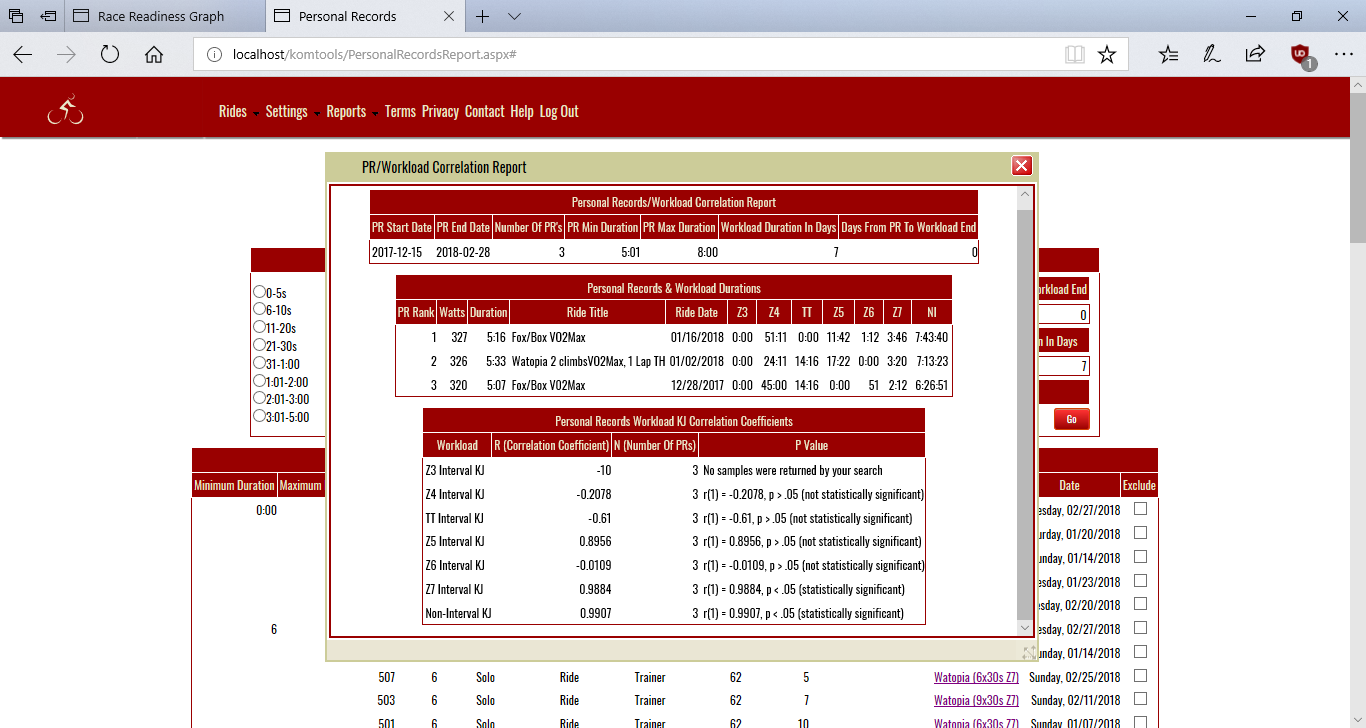
Personal Records/Workload Correlation Panel 1
Personal Records/Workload Correlation Panel 2
Personal Records/Workload Correlation Panel 3
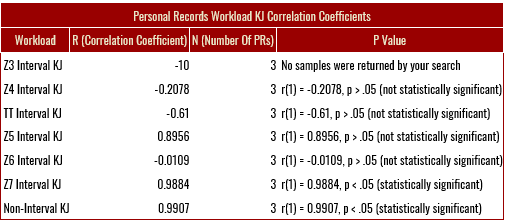
In this case, the correlations show 2 significant results. The first (.9884)is for Z7 Interval KJ which for these windows is solely comprised of the Tabata work. The second (.9907), for Non-Interval work was a bit of a surprise.
Take-Aways
The take-aways?
I think after looking at the amounts of training in these categories that both had something to do with the PR's. Although 3:46 of Tabata work doesn't seem like a lot, the burning legs and impending nausea they produce argue otherwise. The extra 75 minutes or so of Non-Interval work when looking at the work behind PR Rank 1 and PR Rank 3 represents about a 19% increase which I'm not going to discount either. Also, although not significant at a 95% confidence level, there was still a strong correlation (.8956) between the Z5 work and the PR's.
As far as future training goes I'm going to keep the Tabatas at the same level on Sundays for a while assuming there are no races or big rides. Last week, in a attempt to mitigate the "not fully recovered Tuesday problem", I moved my Zone 4 workout to Tuesday in the hopes that a workout that didn't hit zones 5 and 6 would be easier to tolerate then the usual Zone 5 Tuesday workout. This seemed to work pretty well. I'll also be looking around for some research which gives some idea of how often the Tabatas have to be done to maintain the adaptations. Once a week seems to work, but I wondering if maybe once every 2 weeks would work for maintenance.
Increasing the Non-Interval time is something that will happen naturally as the season progresses, but I'll be forcing the issue for the rest of March by increasing the time on the Saturday endurance ride, whether or not I have to use the trainer.
It's been good to have some support from the correlations that my training has been working. I'll continue to use this report and try to figure out ways to improve it.