KOM Informatics: Gauging Interval Quality With Humon Hex Data
I've enhanced KOM Informatics by providing enhanced integration with data from the Humon Hex muscle oxygen sensor. As well as the SmO2 data which has been provided since last fall, the system now captures Humon Hex zone data. As of this writing Hex zone data is only captured on current generation Garmin devices.
Humon Hex Zones provide insight into an athlete's oxygen delivery and consumption. From the Humon website: The Hex classifies the muscle as being in one of four zones:
- 2. Blue (recovery): when the oxygen delivery is greater than the consumption in the muscle, meaning the athlete’s muscles are recovering.
- 3. Green (steady state): when the oxygen delivery and consumption in the muscle is balanced, meaning the athlete is training at a sustainable pace.
- 4. Orange (approaching limit): when the muscle begins consuming more oxygen than what is being delivered, meaning the athlete is nearing their body’s limit.
- 5. Red (limit): when the muscle is consuming significantly more oxygen than what is being delivered, meaning the athlete is training at an unsustainable pace.
I've gotten what I feel to be valuable insights from viewing the Humon data alongside the data the system already provides, particularly the intervals. Here's an example.
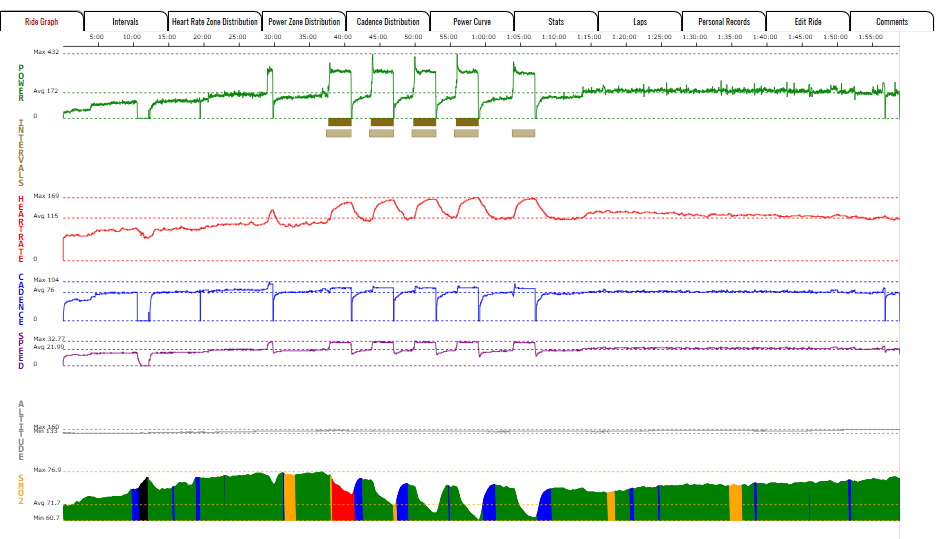
Ride 1 (5x3 VO2Max Intervals)
Click on the thumbnail for a larger image
For the past month or so I've been adding VO2Max intervals to my training mix getting ready for TT season. On this ride I targeted 312 watts which is 90% of the max wattage of my Coggan Zone 5. I figured with this high a wattage 3 minutes would be enough to elicit VO2 Max (or close to it) which is a state where the body can't can't keep up with the oxygen debt.
The Humon Hex Zone data in conjunction with heartrate data caused me to revise my opinion on the effectiveness of these intervals for me. Notice that the first interval in the set is the only one where the Hex zone went to red. Later intervals show green except for a slight sliver of orange in interval 2.
If these intervals were working as intended, I believe they should show an increasing tendency towards red as the set wore on, not a decreasing tendency as was the case. So why red on the first interval only?
I actually didn't have the Hex Zones pulled into my system when I first did this ride so I asked Humon support for some guidance and I was told that it could be the case that my muscles weren't primed well enough for the first interval. Looking at the heartrate section of the graph I think the "muscles not primed" analogy is an apt one for what occurred. It's pretty easy to see that for the first interval my heartrate was slower to respond to the physiological demands of the interval as compared to later intervals, and didn't get nearly as high. So it's not too big of a leap to blame the lower heartrate for failure to keep up with the oxygen demand for interval 1. So was the first interval effective? Heartrate only averaged 143 BPM which is still tempo range for me, while SmO2 dropped 6.5 percentage points which is less then the other intervals in the set, so maybe not so much.
What about the other intervals in the set? As the set wore on through intervals 2,3 and 4 the average heartrates increased (149, 154, 157) and the SmO2 percentage drop increased (8.7, 9, 11.2). However the Humon Hex zone chart showed I was still in the green almost the whole time meaning that oxygen supply was keeping up with demand. I missed the 312W target on the 5th interval, but still made the next zone down (300W), notching a 154 average heartrate, and a 9.8 drop in SmO2. Still green the entire last interval though.
Although heartrate and SmO2 percentage drop were higher in the last 4 intervals then in the first, I'm going to conclude that the latter intervals weren't all they could be either since the Hex zone showed green almost the entire time. Since it didn't show red my assumption that 3:00 @ 312W would be enough to elicit VO2Max was wrong. Given my current fitness levels I either have to raise duration or wattage or both to get there.
Ride 2 (1x14, 1x3 VO2Max Intervals)
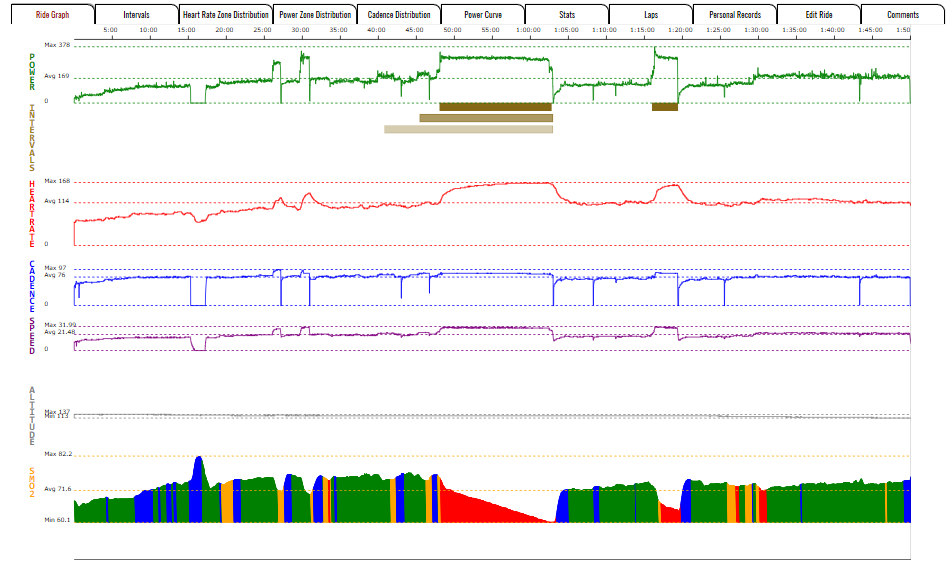
For my next interval session I decided to target 300W (the bottom end of my VO2Max range) rather then 312 and extend the duration as long as I could. It ended @ 14:39 which is pretty good for this time of year for me. Heartrate averaged 160 for this interval and SmO2 dropped 14.8 percent, pegged in the red the entire way. I had to tap out at the end of this interval so I'm pretty sure it elicted VO2Max. 12 minutes later I tried another one and this time could only manage 3 minutes. Heartrate averaged 152 for the latter interval while Smo2 drop came in at 8.2.
Ride 1 came in @ 16:12 of VO2Max work with 12:53 of that time at 312W. Ride 2 came in @18:32 of VO2Max work all of it at 300W. The Ride 1 average heartrate during intervals was 151.4, vs Ride 2 at 159.4 9 BPM lower. The Ride 1 average SmO2 drop for intervals was 9.0 vs Ride 2 at 13.65. Although both sessions felt difficult, the second session was especially uncomfortable. Judging by both the physiological markers and perceived exertion Ride 2 was the better session, extending interval duration was a good decision.
Interval work can be pretty painful so it's good to be able to gauge how effective the work is to ensure the most bang for the buck so to speak. Pulling the Humon Hex Zone data to my application and being able to view it alongside power, heartrate and interval data is a good start to figuring out how to best do this.