KOM Informatics: KPower
A Heartrate Based Algorithm For Estimating Power
So I see this a lot in my Strava feed: People with one bike, (usually a road bike) with a power meter and multiple bikes (cross bikes, gravel bikes mountain bikes) without. IMO, to the extent they ride off road unequipped with power meters, training load is pretty severely underreported. When I look at some of these same cyclists in the context of group road rides I see, IMO the opposite problem - the estimated average power seems to be too high for the effort.
A couple of the early testers of the KOM Informatics system fit this multi-bike profile and have requested a better solution. Although I don't own any off-road bikes (yet) I still have the problem when my power meter equipped Madone is in the shop and I have to rely on my old Madone with no power.
So I decided to create an algorithm that would predict power from heartrate for KOM Informatics. It works by using the rides you have uploaded that contain both power and heartrate data (source rides) as a baseline for making predictions. It decides what rides to use for the baseline by matching statistics about the ride the prediction is for (target ride) with the rides that comprise the baseline. In general then, the more source rides you have uploaded to KOM Informatics, the better the predictions will be.
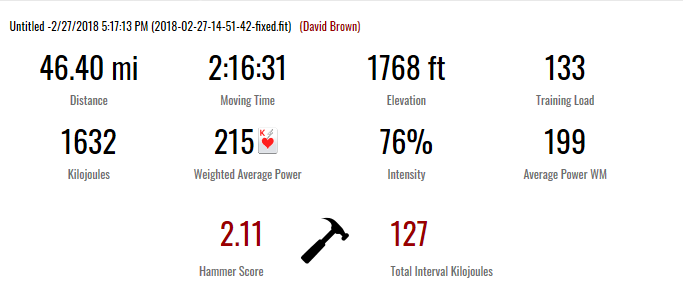
To evaluate how well the algorithm was working I built a form which allows selection of a target ride which in this case does have both power and heartrate and then calculates the predicted power (which I am calling KPower) and plots it against the actual power recorded for the ride on a graph. Viewing the graph allows one to see whether interval efforts in the original power meter ride were covered by the estimated watts generated from the KPower algorithm. The code was later extended to record summary information about each comparison into a database table for later analysis. Here's an example graph:
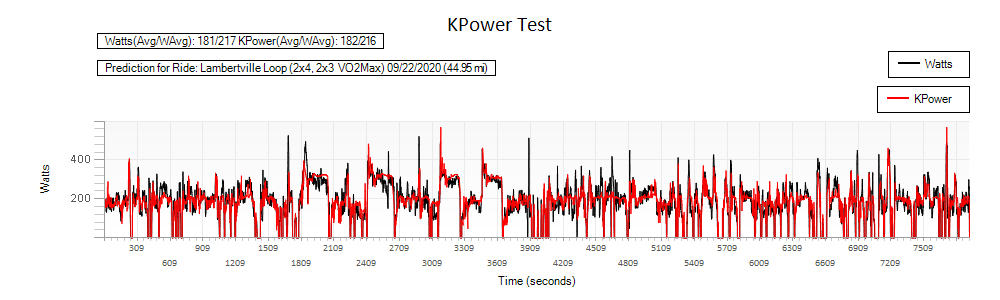
Using this method I recorded summary information for 40 target rides each, for 2 different cyclists. Each cyclist had 20 outdoor and 20 trainer rides in their set of test data. The rides represented the most recent uploads by category (Outdoor vs Trainer). Other then this, no other criteria was used in selecting target rides. Cyclist 1 had 1286 eligible source rides, Cyclist 2 had 144. I did this a number of different times, tweaking the parameters of the algorithm to find out which version yielded the best results, which are directly below.
| KPower Accuracy: All Available Source Rides | ||||
| Cyclist | Outdoor Or Trainer | Average Difference Weighted Average Power Actual vs Predicted | Standard Deviation Actual vs Predicted | Accuracy % |
| 1 | O | -7.2 | 7.5 | 95.88 |
| 1 | T | -0.7 | 8.1 | 96.81 |
| 2 | O | 3.6 | 16.5 | 92.57 |
| 2 | T | -15.45 | 25.9 | 88.01 |
Ideally both the [Average Difference Weighted Average Power Actual vs Predicted] and the [Standard Deviation Actual vs Predicted] would be relatively low for both cyclists and ride categories. Just a low average difference isn't enough. If a set consists of 2 rides both of which have a WAP of 200W, the associated predictions could be 100 W (100 watts low) for the first ride and 300W (100 watts high) for the second and still have 0 average difference Weighted Average Power. Standard deviation measures the amount of dispersion or variation amongst a set of values. Going by this standard the trainer rides for Cyclist 2 were considerably off both in terms of average and standard deviation. I did a little digging to find out why.
So it turns out that 9 of Cyclist 2's 20 trainer rides were under 30 minutes in duration, and another 5 were under 1 hour. (I found that accuracy decreased for shorter rides (r(78) = -0.4642, p < .05 (statistically significant)). 12 of those trainer rides participated in multiple ride days and served purposes like ramp testing and cooldowns from intense interval sessions. The ramp test rides were preceded by much easier ones serving as a warmup, and were characterized by a much higher cardiac efficiency (Weighted Average Power/Average BPM) then the source rides. The cooldown rides from interval sessions had the opposite problem, a much lower cardiac efficiency then the source rides as the cyclist started the cooldown with an extremely elevated heartrate and was pedaling easy watts.
Since pretty much everyone has power of 1 kind or another on trainer rides nowadays I think the trainer results in general should be afforded much less weight in judging how well the KPower algorithm works. I included them in the interests of completeness and transparency and also in the hope that they might reveal something interesting about how the algorithm works in the real world. One lesson I learned from Cyclist 2's trainer rides is that anytime the algorithm loses context by when a day's riding activity is divided into multiple rides, then accuracy suffers. The same type of situations can occur outdoors as well; low cardiac efficiency because of nerves in a warmup ride before a race, or low cardiac efficiency on a cooldown ride after a race.
The issues surrounding Cyclist 2's trainer rides are a couple of examples of a more general class of issue known as a confounding variable. A confounding variable is one that is not accounted for in a prediction like the KPower prediction, that can act as an external influence and change the outcome of the prediction. There are a number of these confounding variables which can be involved in KPower predictions including:
- Excessive heat. Heartrate increases as the body pumps blood to the skin, sweating cools the blood
- Riding too soon after eating. Heartrate increases to deal with digestion.
- Riding off road on technical terrain. Heartrate must expended in upper body efforts to deal with obstacles
- Feeling ill or overly fatigued
- On medication which alters heartrate
To mitigate the effects of confounding variables in KPower calculations, we'll educate users on situations where they arise, and provide a mechanism in the software to adjust KPower wattage prior to uploading a ride. For all of the tests referred to in this article, this mechanism wasn't used, IOW the adjustment was 0.

KPower: Results Differences Between Cyclist 1 & 2
Sharp eyed readers may have caught the differences in accuracy between Cyclist 1's and Cyclist 2's results. Perhaps some of the difference can be attributed to the difference in number of source rides. But I did a little digging and found that accuracy decreased for shorter rides (r(78) = -0.4642, p < .05 (statistically significant)). Cyclist 2's average test ride was 58:20 vs 2:06:49 for Cyclist 1. It may be that the presence of confounding variables in the shorter rides accounts for this effect rather then ride duration itself. I also calculated a Watts Choppiness Index for each of the test rides, this is a measure of the degree of watts fluctuation from moment to moment. A ride that is mostly easy, but is punctuated by many short anaerobic efforts will have a high Watts Choppiness Index. I found that a higher Watts Choppiness Index was a moderately strong predictor of a less accurate prediction (r(78) = 0.4191, p < .05 (statistically significant)). Cyclist 1's average Watts Choppiness Index was 64.24 vs 78.133 for Cyclist 2. The takeaway here is that KPower predictions for watts choppier rides will be a little less accurate then those for smoother rides.
KPower: Effect Of Only 20 Source Rides
People new to the KOM Informatics system won't have the benefit of having many source rides in the system before potentially uploading KPower rides. So we investigated the effect of having only 20 source rides in the system for each Cyclist before making predictions for the target test sets. Results are as follows:
| KPower Accuracy: Limit Of 20 Source Rides | ||||
| Cyclist | Outdoor Or Trainer | Average Difference Weighted Average Power Actual vs Predicted | Standard Deviation Actual vs Predicted | Accuracy % |
| 1 | O | -8.8 | 9.8 | 94.95 |
| 1 | T | 5.05 | 9.5 | 95.82 |
| 2 | O | 6.7 | 23.6 | 90.19 |
| 2 | T | -7.45 | 24.1 | 89.75 |
Compared to the results for the KPower Accuracy: All Available Source rides table above there was less then 1% difference in accuracy (All Available: 93.32%, Limit 20: 92.67%). When a ride gets uploaded without power there will be validation check for at least 20 eligible source rides before calculating KPower; this should be enough to ensure good accuracy.
KPower: Comparison To Strava's Estimated Power
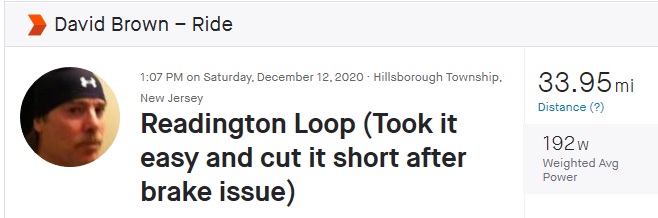
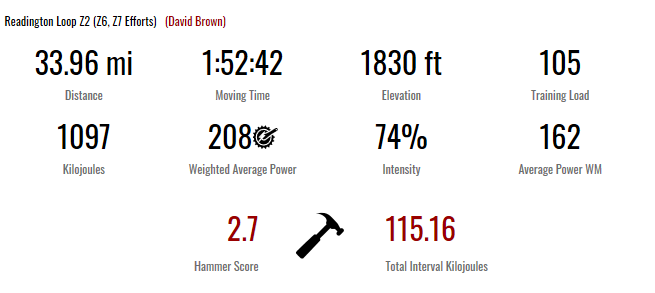
I got curious about how well the KPower predictions would stack up against Strava's estimated power. The selection of rides for this comparison wasn't random because I wanted to achieve a blend of certain types of rides. My opinion was that the Strava formula tended to underestimate power for rides which involved off-road effort, and overestimate power for road group rides. So I included 1 mountain bike ride, and 2 road group rides (1 of these was a road race). One ride, Battenkill included mixed terrain, and mixed group/solo efforts. The remaining 6 rides were solo road rides where IMO, Strava estimated power does pretty well. One of this latter group (Readington Loop) I picked because it involved a number of Z6 and Z7 efforts (WattChoppinessIndex:72.26), and KPower was 21 watts off with it, so I was particularly curious about how Strava's formula would handle it.
I used a third party tool called FitFileRepairTool both to strip the power, and advance all of the timestamps on each of the rides. The latter step is neccesary to avoid getting flagged for submitting a duplicate ride in both systems. Then I just uploaded these rides to both systems, the Power based rides were already there for comparison. The results are as follows:
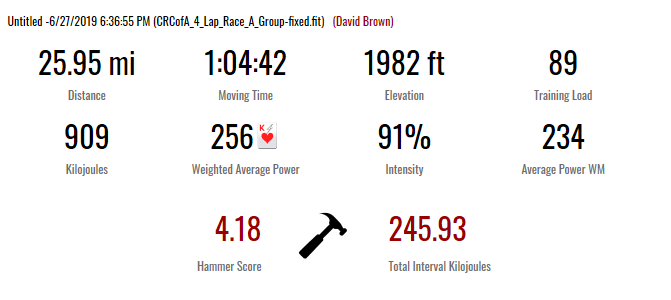
| Ride Title | Weighted Avg Power Power Meter (KOM Informatics) | Weighted Avg Power KPower | Accuracy % KPower | Weighted Avg Power Power Meter (Strava) | Estimated Avg Power Strava Estimated | Accuracy % Strava Estimated | Strava Screenshot (PM) | Strava Screenshot (Est)) | KOM Informatics PM Screenshot | KOM Informatics KP Screenshot |
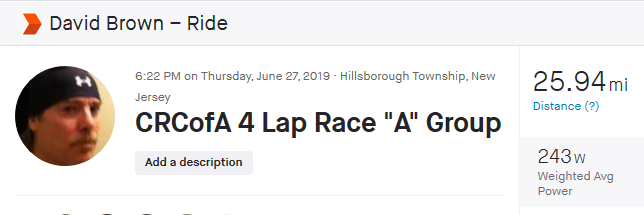
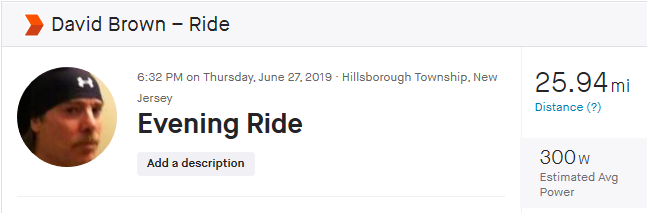
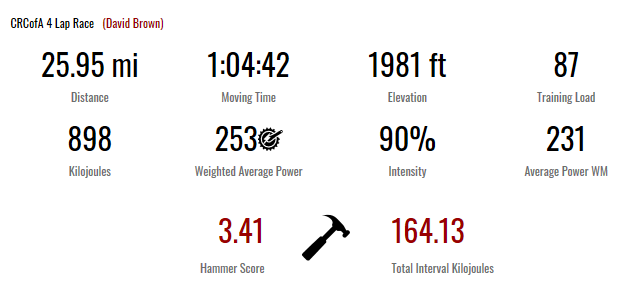
| CRCofA 4 Lap Race "A" Group | 253 | 256 | 98.82 | 243 | 300 | 81.00 | Power Meter | Estimated | Power Meter | Estimated |
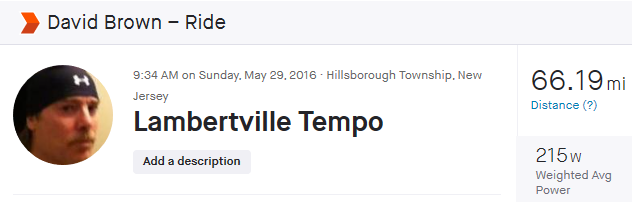
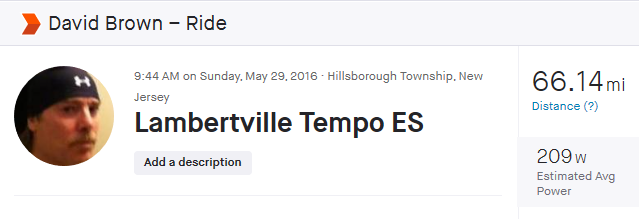
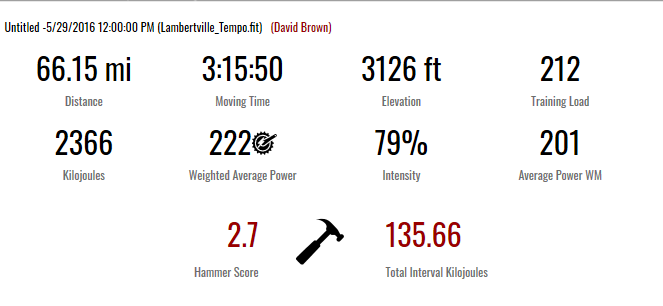
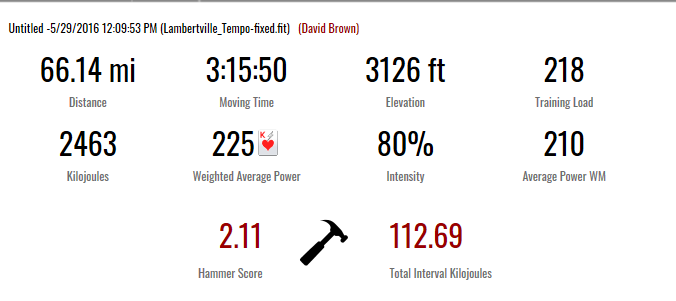
| Lambertville Tempo | 222 | 225 | 98.66 | 215 | 209 | 97.20 | PowerMeter | Estimated | PowerMeter | Estimated |
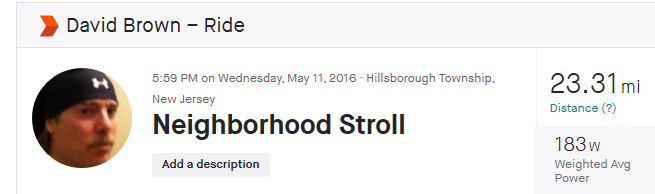
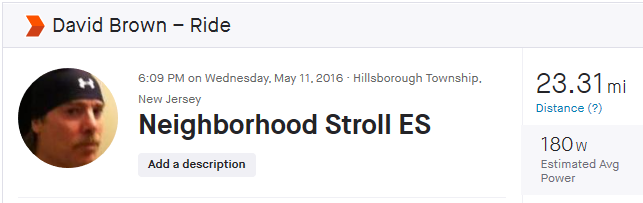
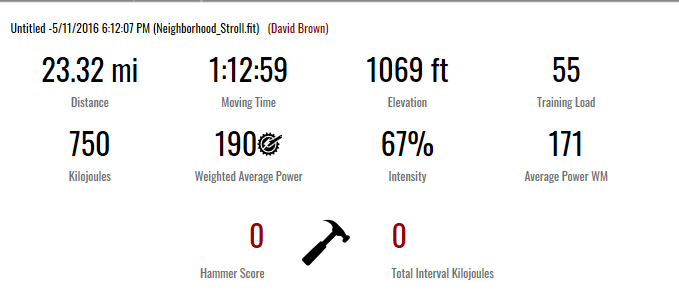
| Neighborhood Stroll | 190 | 169 | 88.94 | 183 | 180 | 98.36 | Power Meter | Estimated | Power Meter | Estimated |
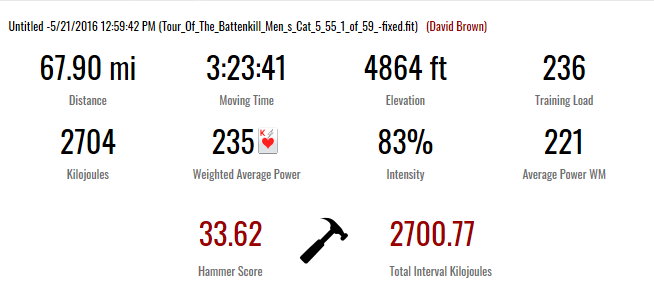
| Tour Of The Battenkill (Men's Cat 5) | 244 | 235 | 96.31 | 235 | 240 | 97.91 | Power Meter | Estimated | Power Meter | Estimated |
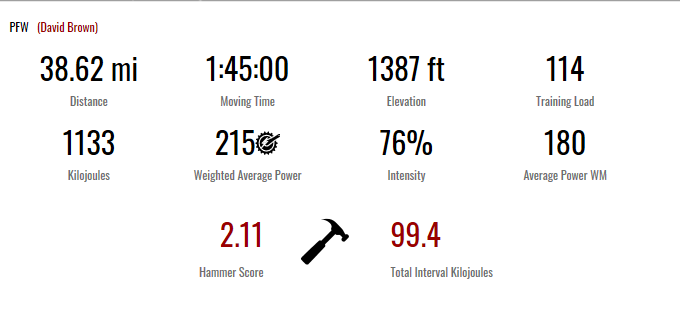
| PFW "A" Ride | 215 | 215 | 100.00 | 206 | 242 | 85.12 | Power Meter | Estimated | Power Meter | Estimated |
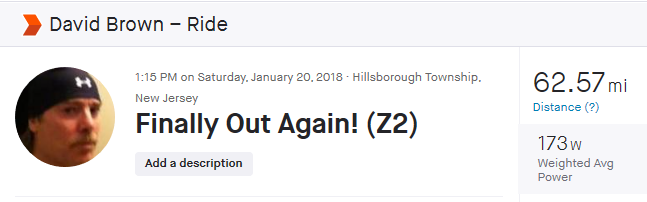
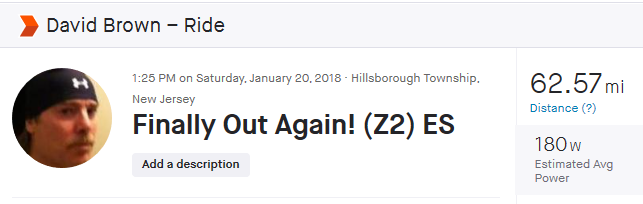
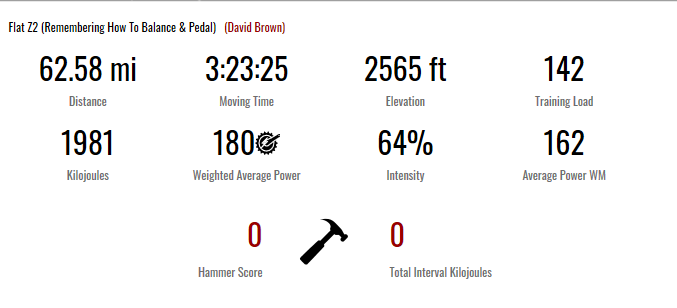
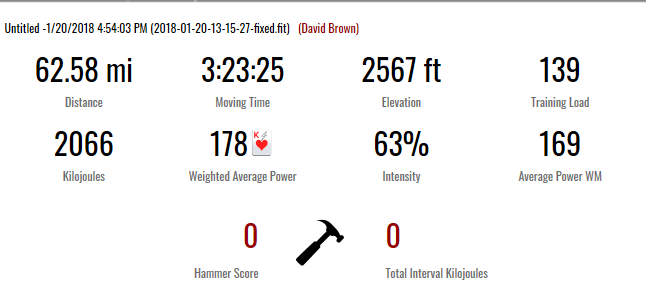
| Flat Z2 (Remembering How To Balance & Pedal) | 180 | 178 | 98.88 | 173 | 180 | 96.11 | Power Meter | Estimated | Power Meter | Estimated |
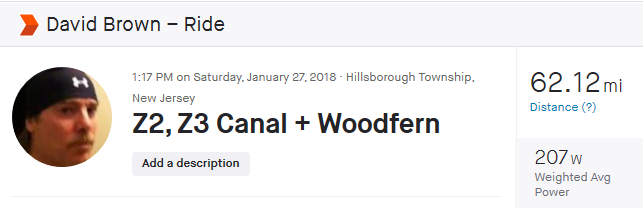
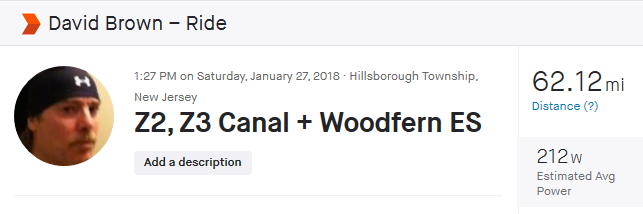
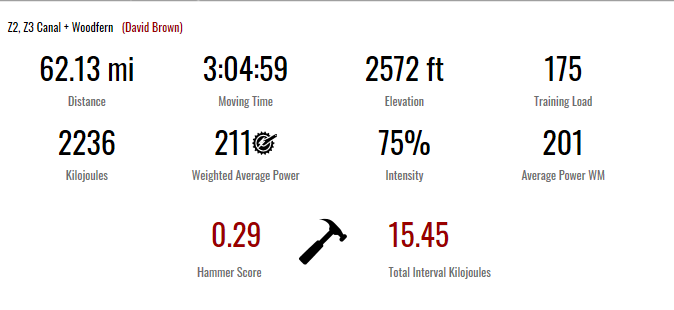
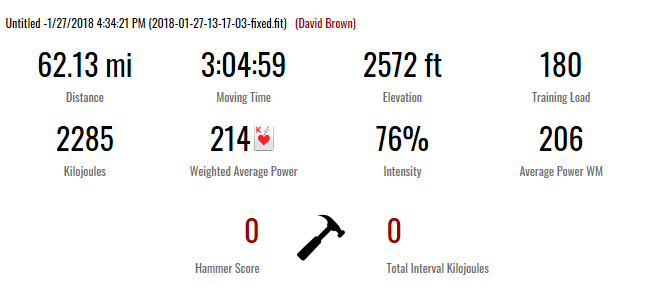
| Z2, Z3 Canal + Woodfern | 211 | 214 | 98.59 | 207 | 212 | 97.64 | Power Meter | Estimated | Power Meter | Estimated |
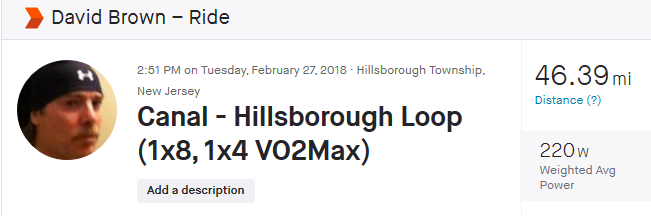
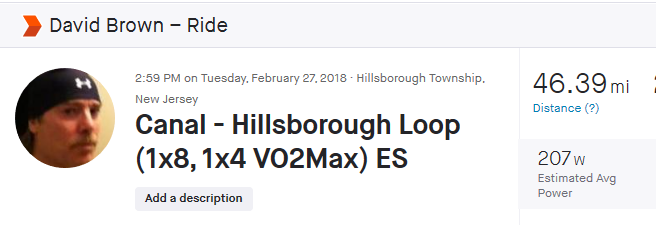
| Canal - Hillsborough Loop (1x8, 1x4 VO2Max) | 227 | 215 | 94.71 | 220 | 207 | 94.09 | Power Meter | Estimated | Power Meter | Estimated |
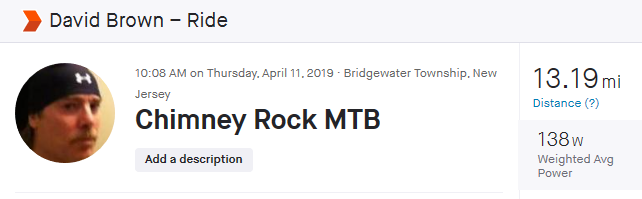
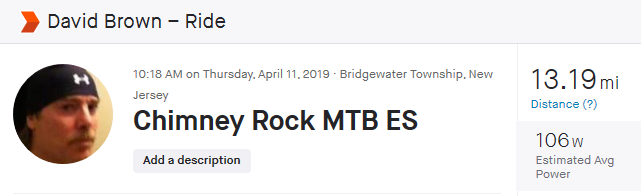
| Chimney Rock MTB | 153 | 171 | 89.40 | 138 | 106 | 76.81 | Power Meter | Estimated | Power Meter | Estimated |
| Readington Loop (Took it easy and cut it short after brake issue) | 208 | 187 | 89.90 | 192 | 148 | 77.08 | Power Meter | Estimated | Power Meter | Estimated |
KPower was more accurate then Strava estimated power for 8 of these 10 rides. Overall KPower had a 95.421 % accuracy rate vs 90.132 % for Strava estimated power. Both algorithms performed well on solo road rides: KPower 94.94% accuracy, Strava Estimated 93.41% accuracy. For those 4 rides which involved group efforts and/or mixed surface condition KPower achieved 96.13% accuracy, Strava Estimated achieved 85.21%.
Takeaways
Version 1 of the KPower algorithm achieved design goals. The KPower heart rate based algorithm can accurately predict power (95.421 % accuracy rate) on smooth roads to offroad technical terrain for both group and solo rides . It was more accurate then Strava's estimated power algorithm based on the rides selected. KPower predictions for watts choppier rides will likely be a little less accurate then those for smoother rides, although this is likely an issue for any estimated power algorithm. The effect of confounding variables which might otherwise rob any heartrate based power prediction of accuracy are partially mitigated through a select list which lets the user adjust the wattage the KPower algorithm emits.