KOM Informatics: Interval Detection & Selection
KOM Informatics is, as far as the writer knows, the first cycling analytics system to detect and display all of the most important and relevant intervals based on training zones, accomplished on a ride. This is in marked contrast to other systems which don't display intervals where the "on" effort is applied gradually, or where the "on" effort is intense but brief. A further contrast, KOM Informatics does not require the user to fiddle with the user interface to pick out intervals or extend intervals which weren't properly detected in the first place.
It turns out that it is relatively easy to detect all of a ride's intervals. But even a short TT of under an hour can yield over 1.5 million intervals, many of which are very similar to one another. Displaying that many on a web page is not going to make anyone happy! KOM Informatics utilizes a heuristic algorithm to distill what can be a potentially large numbers of intervals into the most powerful and important ones generated on your ride. KOM Informatics detects intervals in 2 different contexts. The first context is dependent upon minimum durations that you supply for each of your power zones that you want to set up. The minimum wattage detected is the lowest wattage for a zone. The objective of this type of detection is to find the most energy intensive intervals, which almost always tend to be at the lowest wattage/longest duration intervals per grouping. The system detects these intervals when you upload a ride. The results of this type of detection provide a basis for understanding the composition of your training.When the system aggregates the data in various reports, you'll get to know how much time you spent at interval intensity for each of your zones for a given training period. If you set a PR, or attain strong results in a race you'll be able to tell the exact mix of training which produced that PR or results.
KI Interval Detection: 35 minute TT
Over 1.5 million raw intervals detected
13 intervals displayed
12 in IZD
1 IZD
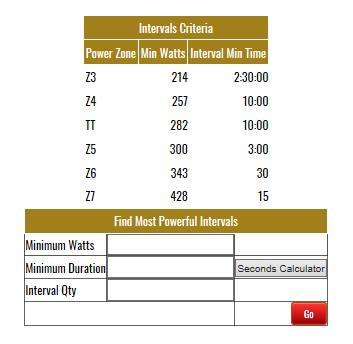
The second context is searching for highest wattage intervals for a ride based on minimum wattages, durations and quantities that you supply on a form located on the intervals tab of the Ride page. After providing your selections and clicking go, the system will return the highest wattage intervals that meet your search criteria, along with averages. If you do the same workouts on a regular basis, comparing the output of this search across rides can be a useful way to gauge progress.
Zone based intervals are used to create an Interval Zone Distributions (IZD) for each ride. This is a rollup of the time and kilojoules spent at or above interval minimum duration in each power zone. An individual second only counts in the highest power zone in which it occurs for the IZD. In real life though, it is frequently the case that intervals are "stacked" (an individual second can belong to intervals in multiple zones). Say for example you do a Zone 5 (VO2Max) effort that's 8 minutes long. Further, let's suppose you've defined your Zone 4 (Threshold) minimum duration at 10 minutes. Under these conditions KOM Informatics will detect a Zone 4 Interval underneath the Zone 5 effort you intended. This detected Zone 4 effort will start a minute or so before the Zone 5 effort, and end a minute or so afterwards. KOM Informatics will display the Zone 4 interval on the Ride Graph, but it likely will not be included in the Interval Zone Distribution for the ride. This is because the system analyzes the quality of all lower zone intervals that are covered by a higher zone interval. It looks at the average watts of the uncovered seconds. If those seconds don't average at least 90% of the minimum wattage for the zone, the interval won't count towards the Interval Zone Distribution. Also, if a lower zone interval is completely covered by a higher zone interval, the lower zone interval won't count towards the IZD. If you are currently using another system that displays intervals but doesn't display stacked intervals in a race context you are likely not getting the whole story.
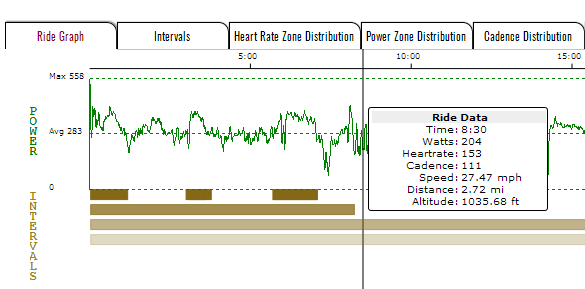
This image is clipped from the Ride Graph of a KOM Informatics ride page. The ride is from the NJBA's 2017 Silvermine TT which was a "full gas" effort 34:41 for this rider. Each layer of the intervals depicted represents efforts in descending zones, starting from Z6(Anaerobic), Z5(VO2Max), TT(Upper Threshold), and Z4(Threshold Zones). It's pretty easy to see that every second on this ride is involved in multiple intervals, hence the term "stacked intervals".
These images are clipped from the same ride page as the one above. The table lists the individual intervals accomplished. The pie chart is the Interval Zone Distribution for the ride. The third image shows the Find Most Powerful Intervals form where you can search for a ride's most powerful intervals based on your minimum wattages and durations.
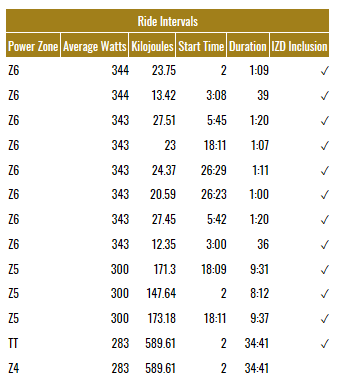
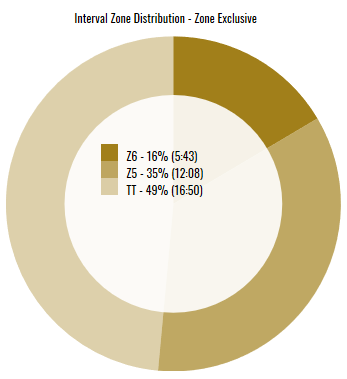
By looking at the intervals table in conjunction with the Interval Zone Distribution (IZD) pie chart you can see how individual intervals contribute to the IZD.
- The Z4 (Threshold) interval (duration 34:41) doesn't count at all since it is completely covered by a TT (Upper Threshold) interval. The IZD Inclusion column in the table for the interval is not checked.
- The TT (UpperThreshold) interval (duration 34:41) does participate in the IZD. The system has checked those seconds of the interval that are not shared with higher zone intervals and found them to average at least 90% of the minimum wattage defined for the TT zone. Not all of the 34:41 counts towards the IZD because some of it occurs in the presence of higher zone intervals. The IZD Inclusion column in the table for the interval is checked indicating it does contribute to the IZD.
- The 3 Z5 (VO2Max) intervals all participate in the IZD. The system has checked those seconds that are not shared with higher zone intervals for each of the Z5's and found them to average at least 90% of the average for the Z5 zone. Not all of the Z5 seconds count towards the IZD, as at least some of those seconds also participate in a Z6 higher zone interval. The IZD Inclusion column in the table for the intervals are checked indicating they do contribute to the IZD.
- All of the Z6 intervals participate in the IZD. Because there is significant overlap between some of the Z6's you can't just add up the duration of each of them to come up with the total in the IZD. The system counts each of the shared seconds between intervals which occur in the same zone only once. The IZD Inclusion column in the table for the intervals are checked indicating they do contribute to the IZD.