Contents
 Welcome
 Getting Started
    System Requirements
    Cycling Equipment Requirements
    Training Knowledge Requirements
    Registration
    Creating Power Zones/Interval Specifications
    Creating Heart Rate Zones
    Training Load Settings
    Logging In
    Interval Detection & Selection Overview
 Rides
    Uploading A Ride
       Handling Missing Seconds
       Wahoo Cloud Sync
       Garmin Connect Sync
       Ride Backfill Request Utility
       Ride Load Status Checker
    Adding A Manual Ride
    Finding Rides
    Deleting Rides
    Exporting Rides
    Ride Feed
    Ride Calendar
    The Ride Page
       Ride Header
       Map
       Ride Graph
       Intervals
       Heart Rate Zone Distribution
       Power Zone Distribution
       Cadence Distribution
       Power Curve
       Stats
       Laps
       Training Progress
       Edit Ride
       Comments
       Zwift Workout Generator
       Workout Performance Report
    KPower
       Uploading KPower Rides
       Curating KPower Source Rides
 Reports
    Race Readiness Graph
    Power Curves
    Rider Stats Year Over Year
    Personal Records
       Personal Records Overview
       Personal Records Report
       Personal Records - Workload Correlations
    Ride Summary Charts
    Critical Power
       Overview
       Generating A CP Graph
       Critical Power History
       Critical Power History Backfill
    Fitness Signature
    Hammer Score Leaderboard
    Training Effectiveness
    Rider Assessment
    Plan Strategy
 Workouts
    Workout Builder Screen
    Adding A Workout
    Adding A Block
    Adding A Component To The Workout Graph
    Deleting A Block
    Insertion Points
    Fixing A Block Mistake
    Multi Select Blocks
       Building
       Saving As A Component
       Removing Multi Select
    Finding Workouts
    Editing Workouts
    Deleting A Workout
    Generating A Zwift Workout
    Components
    Downloading Workouts
    Workout Projections
    Scheduling A Workout
       Rescheduling A Workout
    Deleting A Workout From The Schedule
    Viewing A Workout Performance Report
    Importing A Workout
    Interval Advisor
       Saving A Recommendation
       Adaptive Workouts
    Curating Interval Advisor Source Rides
 Other Functions
    Changing General Settings
    Changing Rider Assessment Settings
    Changing Power Zones/Interval Specifications
    Changing Heart Rate Zones
    Changing Training Load Settings
    Coaches And Friends
    Viewing The Terms Of Service
    Viewing The Privacy Policy
    Logging Out
    Evaluating Progress
    Changing Advanced Settings
    Notifications
       Insights
          Critical Power AWC Check
          Training Effectiveness
          Interval Workload Levels
       Warnings
          FTP CP Mismatch Warning
    Changing Bicycle Settings
 FAQ
    General FAQ
  
Index

Home > Reports > Critical Power > Generating A CP Graph

Generating A CP Graph


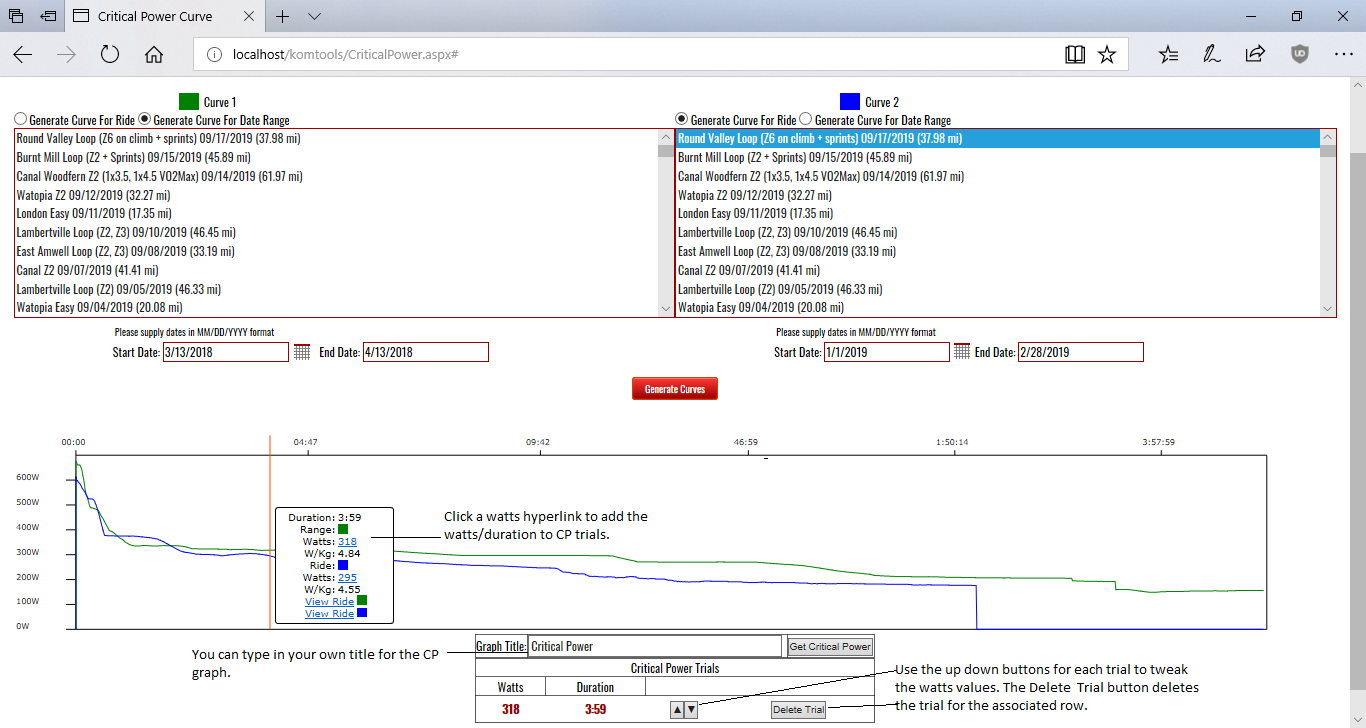
 The entry point to generate a Critical Power graph is the Power Curves page. See the Power Curves help topic for
detailed information on how to display interactive mean maximal power curves based on either an individual ride or date
range. Once you've displayed a power curve:

  1. Hovering over the interactive graph with the mouse displays an InfoBox with the Watts and Watts/Kg for the given duration, for each curve.
  2. Clicking on the graph freezes the InfoBox and allows you to click inside.
  3. In the InfoBox, the watts for each selection are hyperlinked. Clicking on the hyperlink will cause the Watts/Duration to be selected as a Critical Power trial. The trial will appear in the Critical Power section of the screen beneath the graph.
  4. You can change the watts for a trial by clicking the [Up] or [Down] arrow buttons for a trial.
  5. You can delete a trial by clicking the [Delete] button for that trial.
  6. You can type in a title for the graph in the Graph Title textbox
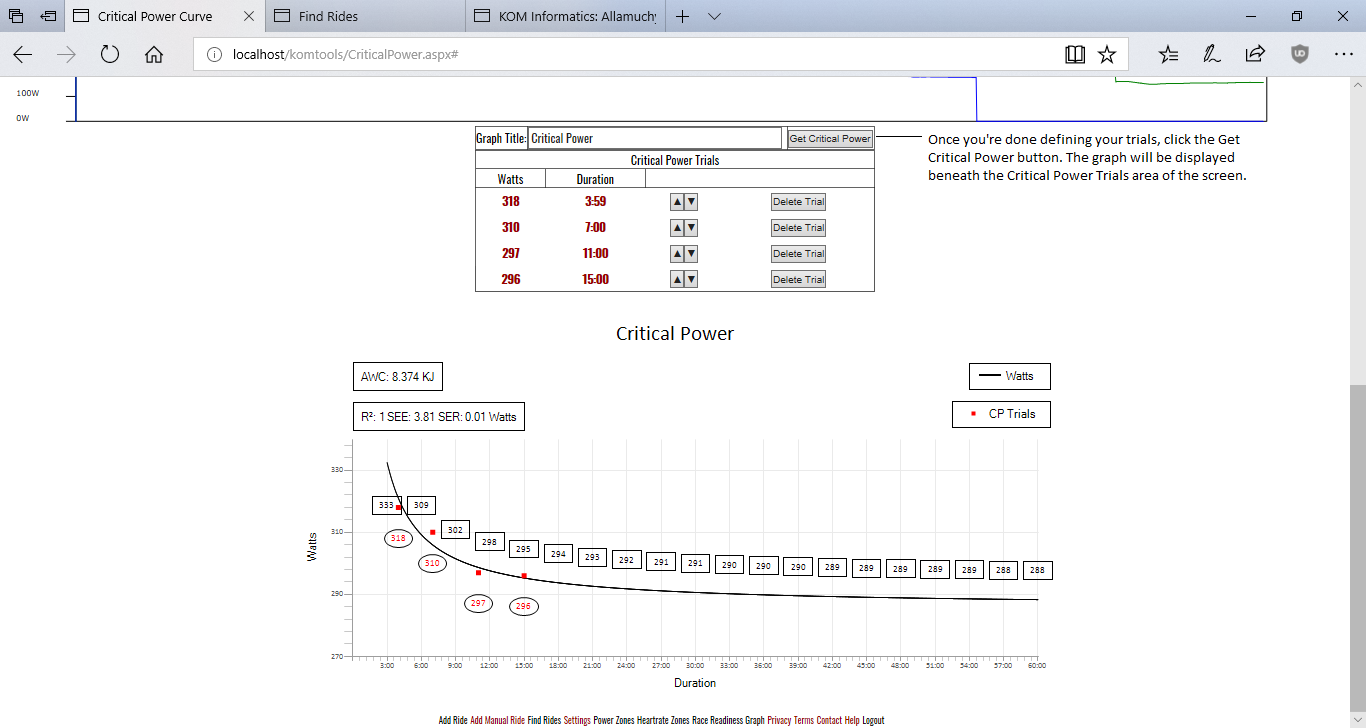
  7. Once you're done defining trials click the [Get Critical Power] button to generate the CP graph. It will appear beneath the Critical Power Trials table.
  8. The CP graph is implemented as an image. You can use your browser's Save Image As utility to save the image to your local file system.


Here is an explanation of the abbreviations used in the graph:

  1. AWC: Stands for Anaerobic Work Capacity. We all have a limited store of energy we can use when we're working above CP. The harder you go, the faster you use it up.
  2. R²: This is a statistical measure of how well the predicted points correlate with the observed trials. 1 is the best correlation.
  3. SEE: Stands for Standard Error of the Estimate. Lower is better.
  4. SER: Stands for Standard Error of the Regression. Lower is better.

Here's what the CP graph looks like:

See also

  
HelpConsole 2007 - Standard

Copyright © 2004 - 2007 Extreme Ease Software Inc. All Rights Reserved.