|
Home > Reports > Personal Records > Personal Records - Workload Correlations
Personal Records - Workload Correlations
The Personal Records/Workload Correlation report provides information on the strength and direction of the linear relationship between your training and your performance. It can provide insights into which aspects of your trainiing are having the biggest effect on the performance abilities that can make a critical difference to your success as a competitive cyclist.
The training side utilizes the kilojoules recorded for the Interval Zone Durations for each ride, along with the Non-Interval kilojoules for each ride. You specify a workoad window each time you run the report. A workload window is a block of training days which are defined by the days from the PR to the workload end (looking back in time), and the duration of the workload in days.
The report uses Personal Records wattages on the performance side. Although the system records personal records in 18 time buckets for each ride, we recognize that true attempts to best a PR are few and far between. This is the main reason why the Personal Records Report alllows you to limit the number of PR's returned by the report.
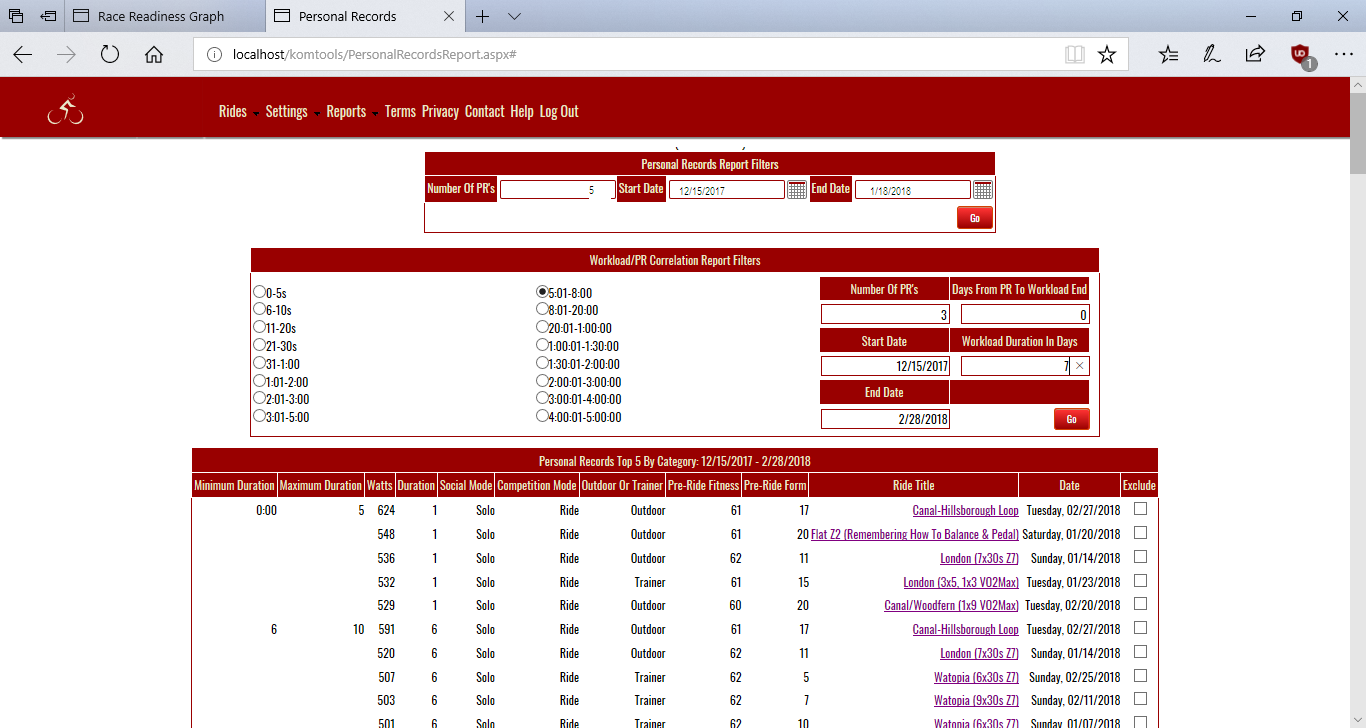
To run Personal Records/Workload Correlation report you have to run the Personal Records Report first. After running the report and getting back a list of Personal Records:
- Select the time bucket you're interested in. Scroll to that section of the PR Report and decide if there are any PR's you want to exclude from the Correlation analysis. You may want to exclude a PR from the correlation analysis if you feel you weren't trying your hardest, or you weren't fully recovered on the day of a particular effort. Another reason to exclude an effort might be due to different conditions surrounding the PR to be excluded versus the PR's to be included. Perhaps it was a combined seated and standing effort versus seated efforts, or an afternoon effort versus morning efforts.
- To exclude an effort from the correlation analysis click the Exclude checkbox on the right hand side of the PR.
- Scroll back up to the top of the page to the Personal Records/Workload Correlation Filters section and fill in how many PR's you want to include in the Correlation analysis.
- Click the radio button that corresponds to the time bucket that holds the PR's you're interested in.
- Then, fill in number of days duration, and how many days removed from the workload window you're interested in.
- Click [Go] to run the Personal Records/Workload Correlation report.
The Personal Records/Workload Correlation report pops up in it's own window.
See also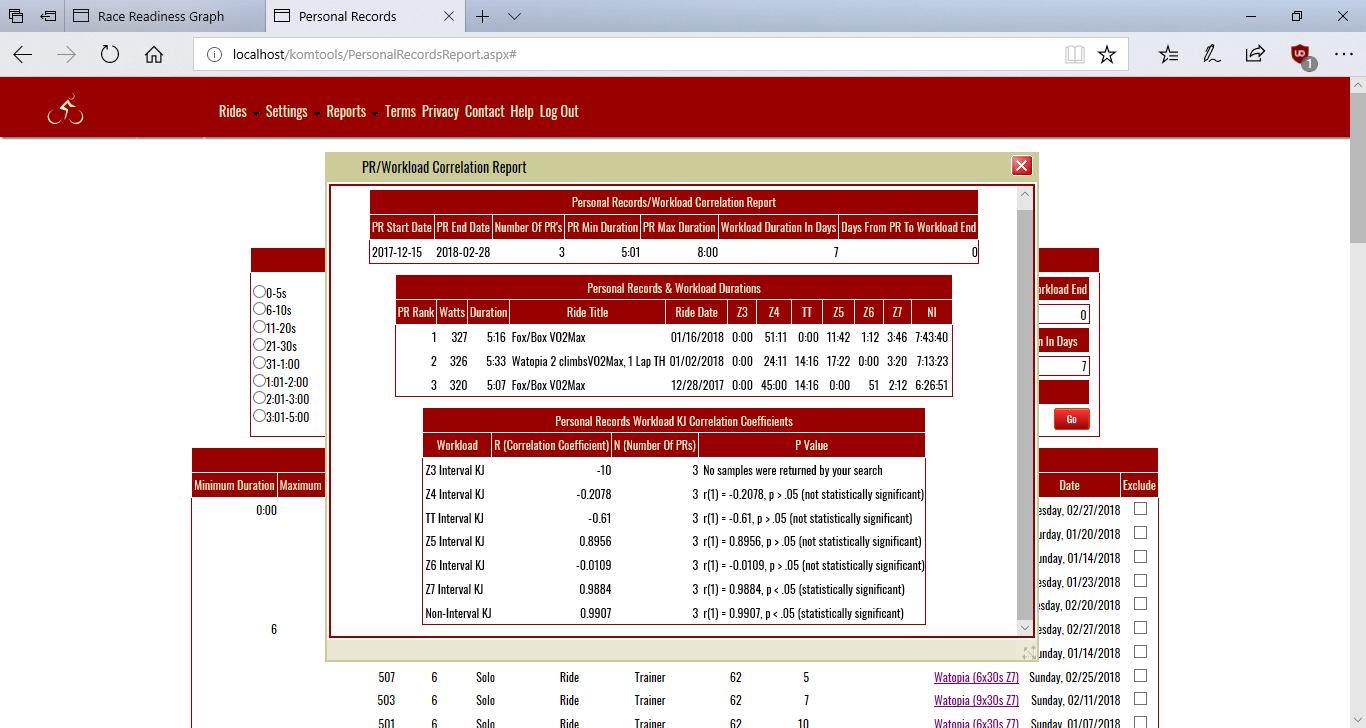
Use the following guidelines to interpret the results
- Locate the correlations that show as statistically significant in the Personal Records Workload KJ Correlation panel.
- Locate the workload for that row in the Personal Records & Workload Durations panel. Decide whether or not the duration listed for the workload represents a significant effort over the workload window.
- If you find a statistically significant correlation and a significant amount of effort for the workload it's possible to make a strong case for the workload in question having a large causal influence on the PR in question.
Technically, statistical significance in the context of this report refers to the probability of the null hypothesis being true for a population based on the samples supplied for the correlation analysis. For those of you who are saying WTH here's a translation.
The null hypothesis for all of these correlations is that the training workload had no effect on the personal record. The notion of statistical significance asks us to assume, for the sake of argument that the null hypothesis is true, and then goes on to look at the chances of encountering the same or even higher correlation in a general population given that the null hypothesis is true. If the likelihood of this falls beneath a certain level, selected by the researcher prior to the study, then this would lead us to reject the null hypothesis, which in our case is that a training workload had no effect on a PR. This likelihood is called the p value.
Note that rejecting the null hypothesis doesn't mean that the alternate hypothesis (that the training in question caused the PR) is true. We urge you to look carefully at other possible explanations. For example:
- Perhaps the workload was a very small amount for the workload window. Even if the correlation were high common sense would hopefully lead one to conclude that there wasn't much causal effect.
- It may be that your PR was set at a different time of day. We've seen one study related to cycling which shows that more power PR's are set in the afternoon as opposed to morning.
- There may be differences in sleep on the night prior to an attempt, or differences in diet.
We chose a .05 significance level for this analysis. The use of this significance level along with the Pearson Product Moment Correlation has widespread use in many fields of research. We've seen both used in exercise physiology studiies involving cycling performance. A p value of less then .05 is the same as saying the confidence level is 95%.
Here's how to intepret the terms in the p value column from the Personal Records/Workload KJ Correlation Coefficients panel from the report:
- "r(n)=" r or r value refers to the correlation coefficient. n refers to degrees of freedom ie the number of values in the final calculation of a statistic that are free to vary. For the analysis employed for the report it is always the number of Workload/PR pairs reported on for a single correlation - 2.
- The number that follows the first expression described directly above is the correlation coefficient.
- p is the likelihood of encountering the same or higher correlation in a population given that the that the null hypothesis is true. If p < .05, the significance level chosen, we can reject the null hypothesis.
| 


