Contents
 Welcome
 Getting Started
    System Requirements
    Cycling Equipment Requirements
    Training Knowledge Requirements
    Registration
    Creating Power Zones/Interval Specifications
    Creating Heart Rate Zones
    Training Load Settings
    Logging In
    Interval Detection & Selection Overview
 Rides
    Uploading A Ride
       Handling Missing Seconds
       Wahoo Cloud Sync
       Garmin Connect Sync
       Ride Backfill Request Utility
       Ride Load Status Checker
    Adding A Manual Ride
    Finding Rides
    Deleting Rides
    Exporting Rides
    Ride Feed
    Ride Calendar
    The Ride Page
       Ride Header
       Map
       Ride Graph
       Intervals
       Heart Rate Zone Distribution
       Power Zone Distribution
       Cadence Distribution
       Power Curve
       Stats
       Laps
       Training Progress
       Edit Ride
       Comments
       Zwift Workout Generator
       Workout Performance Report
    KPower
       Uploading KPower Rides
       Curating KPower Source Rides
 Reports
    Race Readiness Graph
    Power Curves
    Rider Stats Year Over Year
    Personal Records
       Personal Records Overview
       Personal Records Report
       Personal Records - Workload Correlations
    Ride Summary Charts
    Critical Power
       Overview
       Generating A CP Graph
       Critical Power History
       Critical Power History Backfill
    Fitness Signature
    Hammer Score Leaderboard
    Training Effectiveness
    Rider Assessment
    Plan Strategy
 Workouts
    Workout Builder Screen
    Adding A Workout
    Adding A Block
    Adding A Component To The Workout Graph
    Deleting A Block
    Insertion Points
    Fixing A Block Mistake
    Multi Select Blocks
       Building
       Saving As A Component
       Removing Multi Select
    Finding Workouts
    Editing Workouts
    Deleting A Workout
    Generating A Zwift Workout
    Components
    Downloading Workouts
    Workout Projections
    Scheduling A Workout
       Rescheduling A Workout
    Deleting A Workout From The Schedule
    Viewing A Workout Performance Report
    Importing A Workout
    Interval Advisor
       Saving A Recommendation
       Adaptive Workouts
    Curating Interval Advisor Source Rides
 Other Functions
    Changing General Settings
    Changing Rider Assessment Settings
    Changing Power Zones/Interval Specifications
    Changing Heart Rate Zones
    Changing Training Load Settings
    Coaches And Friends
    Viewing The Terms Of Service
    Viewing The Privacy Policy
    Logging Out
    Evaluating Progress
    Changing Advanced Settings
    Notifications
       Insights
          Critical Power AWC Check
          Training Effectiveness
          Interval Workload Levels
       Warnings
          FTP CP Mismatch Warning
    Changing Bicycle Settings
 FAQ
    General FAQ
  
Index

Home > Reports > Ride Summary Charts

Ride Summary Charts

Ride Summary Charts enable the visualization of ride by ride progress for 38 (as of this writing) ride based statistics. To navigate to Ride Summary charts highlight [Reports] and click on [Ride Summary Charts] from the main menu.

You provide a Start Date and  an End Date to limit the rides you want to report on. Additionally, you can enter in a Tag to further limit the rides returned by the search. The system will attempt to match the tag on a "contains" basis in the Description column of a ride. The corresponding Description textarea is found on the Edit Ride tab of each ride page.

There is a special tag (HWU) which stands for Humon Warm Up. It's supposed to used on rides where you're performing a threshold test using the Humon protocol.  There are 2 statistics that are meant to be used with respect to Humon threshold tests: Watts @ Humon First Red Second and BPM @ Humon First Red Second. Although these statistics will still work with untagged rides, they are pretty meaningless when done outside of a threshold test, and they will impart a big performance hit to graph display when done in this context. 

You also must provide a Width and Height for the chart (in pixels) and select a background color (either White or Black).

You must also select at least one, and not more then 6 Data Series per graph. You configure a Data Series by selecting the name of the series along with the Chart Type (either line or point), Color, and Y Axis Type (either Primary or Secondary). When you are done configuring a series you click the [Add Data Series] button to add the series to the list of series that will eventually be displayed on the graph. After adding a series to the graph, you can delete it by clicking on the [Delete] button for that series. When you are done configuring Data Series's you click the [Build Chart] button to build the chart.

The charts are implemented as images.  If you are using a desktop browser you should be able to use that browser's utility to save the image to your local file system if so desired. For instance in Firefox/Win XP you can right click on an image and click [Save As] from the ensuing context menu.

Here's an example of a chart that's displaying all the Humon threshold tests for 2019:


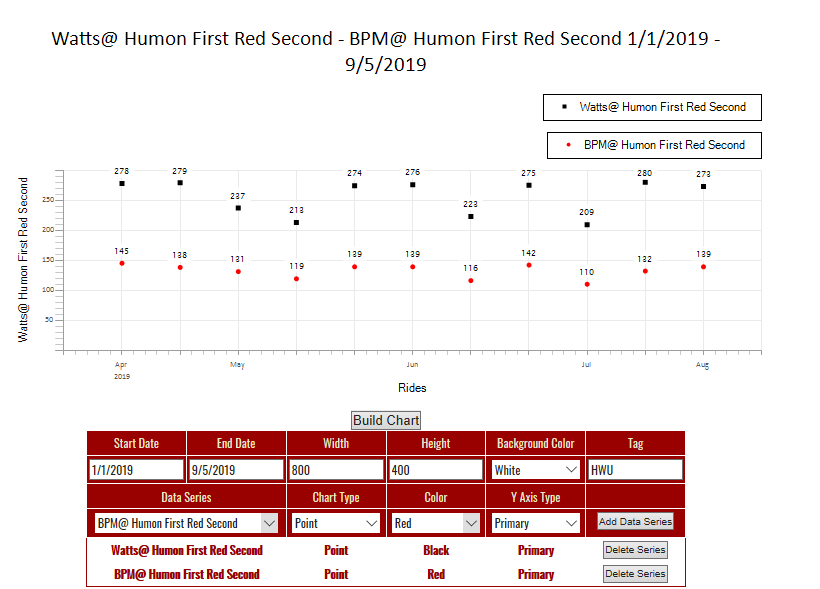
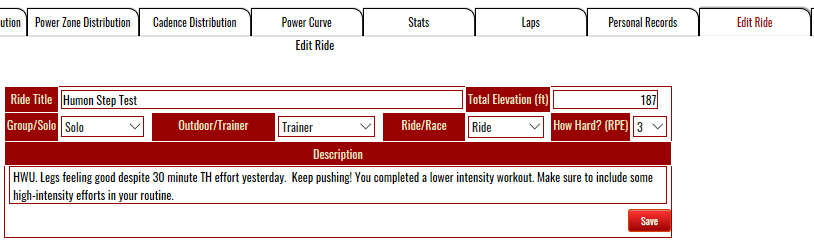
You enter in HWU in the Description textarea on the Edit Ride tab of a ride page to make that ride appear in an HWU chart.


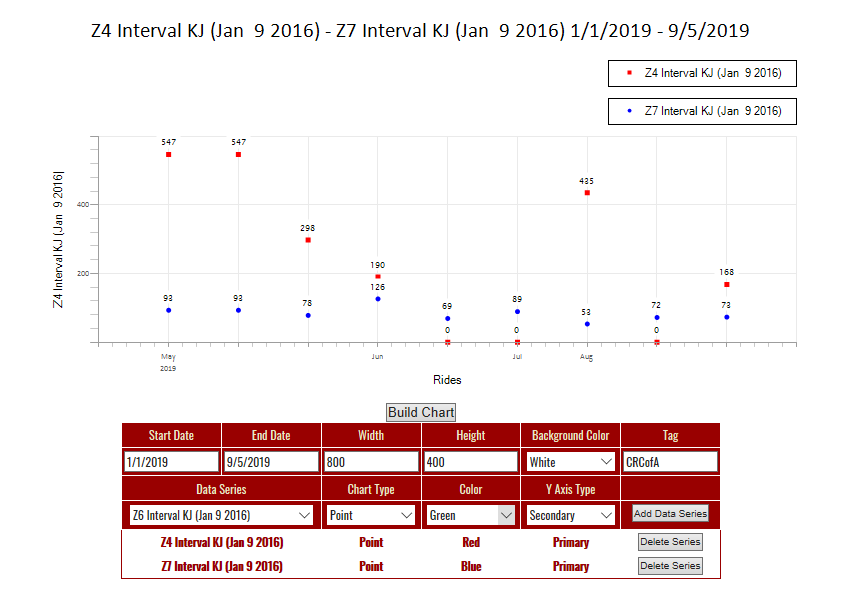
You can invent your own tags and use them the same way as in the preceding example. This chart uses the tag "CRCofA" to limit the chart's reporting to a series of 2019 club races.


Here's the Comments field of a ride page that the above chart is reporting on:
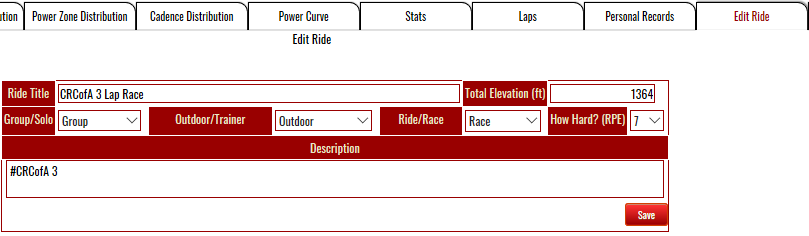

See also

  
HelpConsole 2007 - Standard

Copyright © 2004 - 2007 Extreme Ease Software Inc. All Rights Reserved.